As part of our documented experiments with methods for entity resolution tasks (see our publication "Entity Resolution: Learned Representations of Tabular Data with Classic Neural Networks") this project attempts to solve an entity resolution problem based on blocking rules and a KMeans clustering algorithm.
The project is an experimental prototype for research and does not address full error handling or production standards, and it's rather a setup for quick prototyping.
The proposed approach has three sequential stages. Firstly the generation of a hierarchical graph for records in blocks, followed by the generation of a record relationship graph with components; finally we cluster the records for each component using a K-Means algorithm, an approach we refer herein as KLSH.
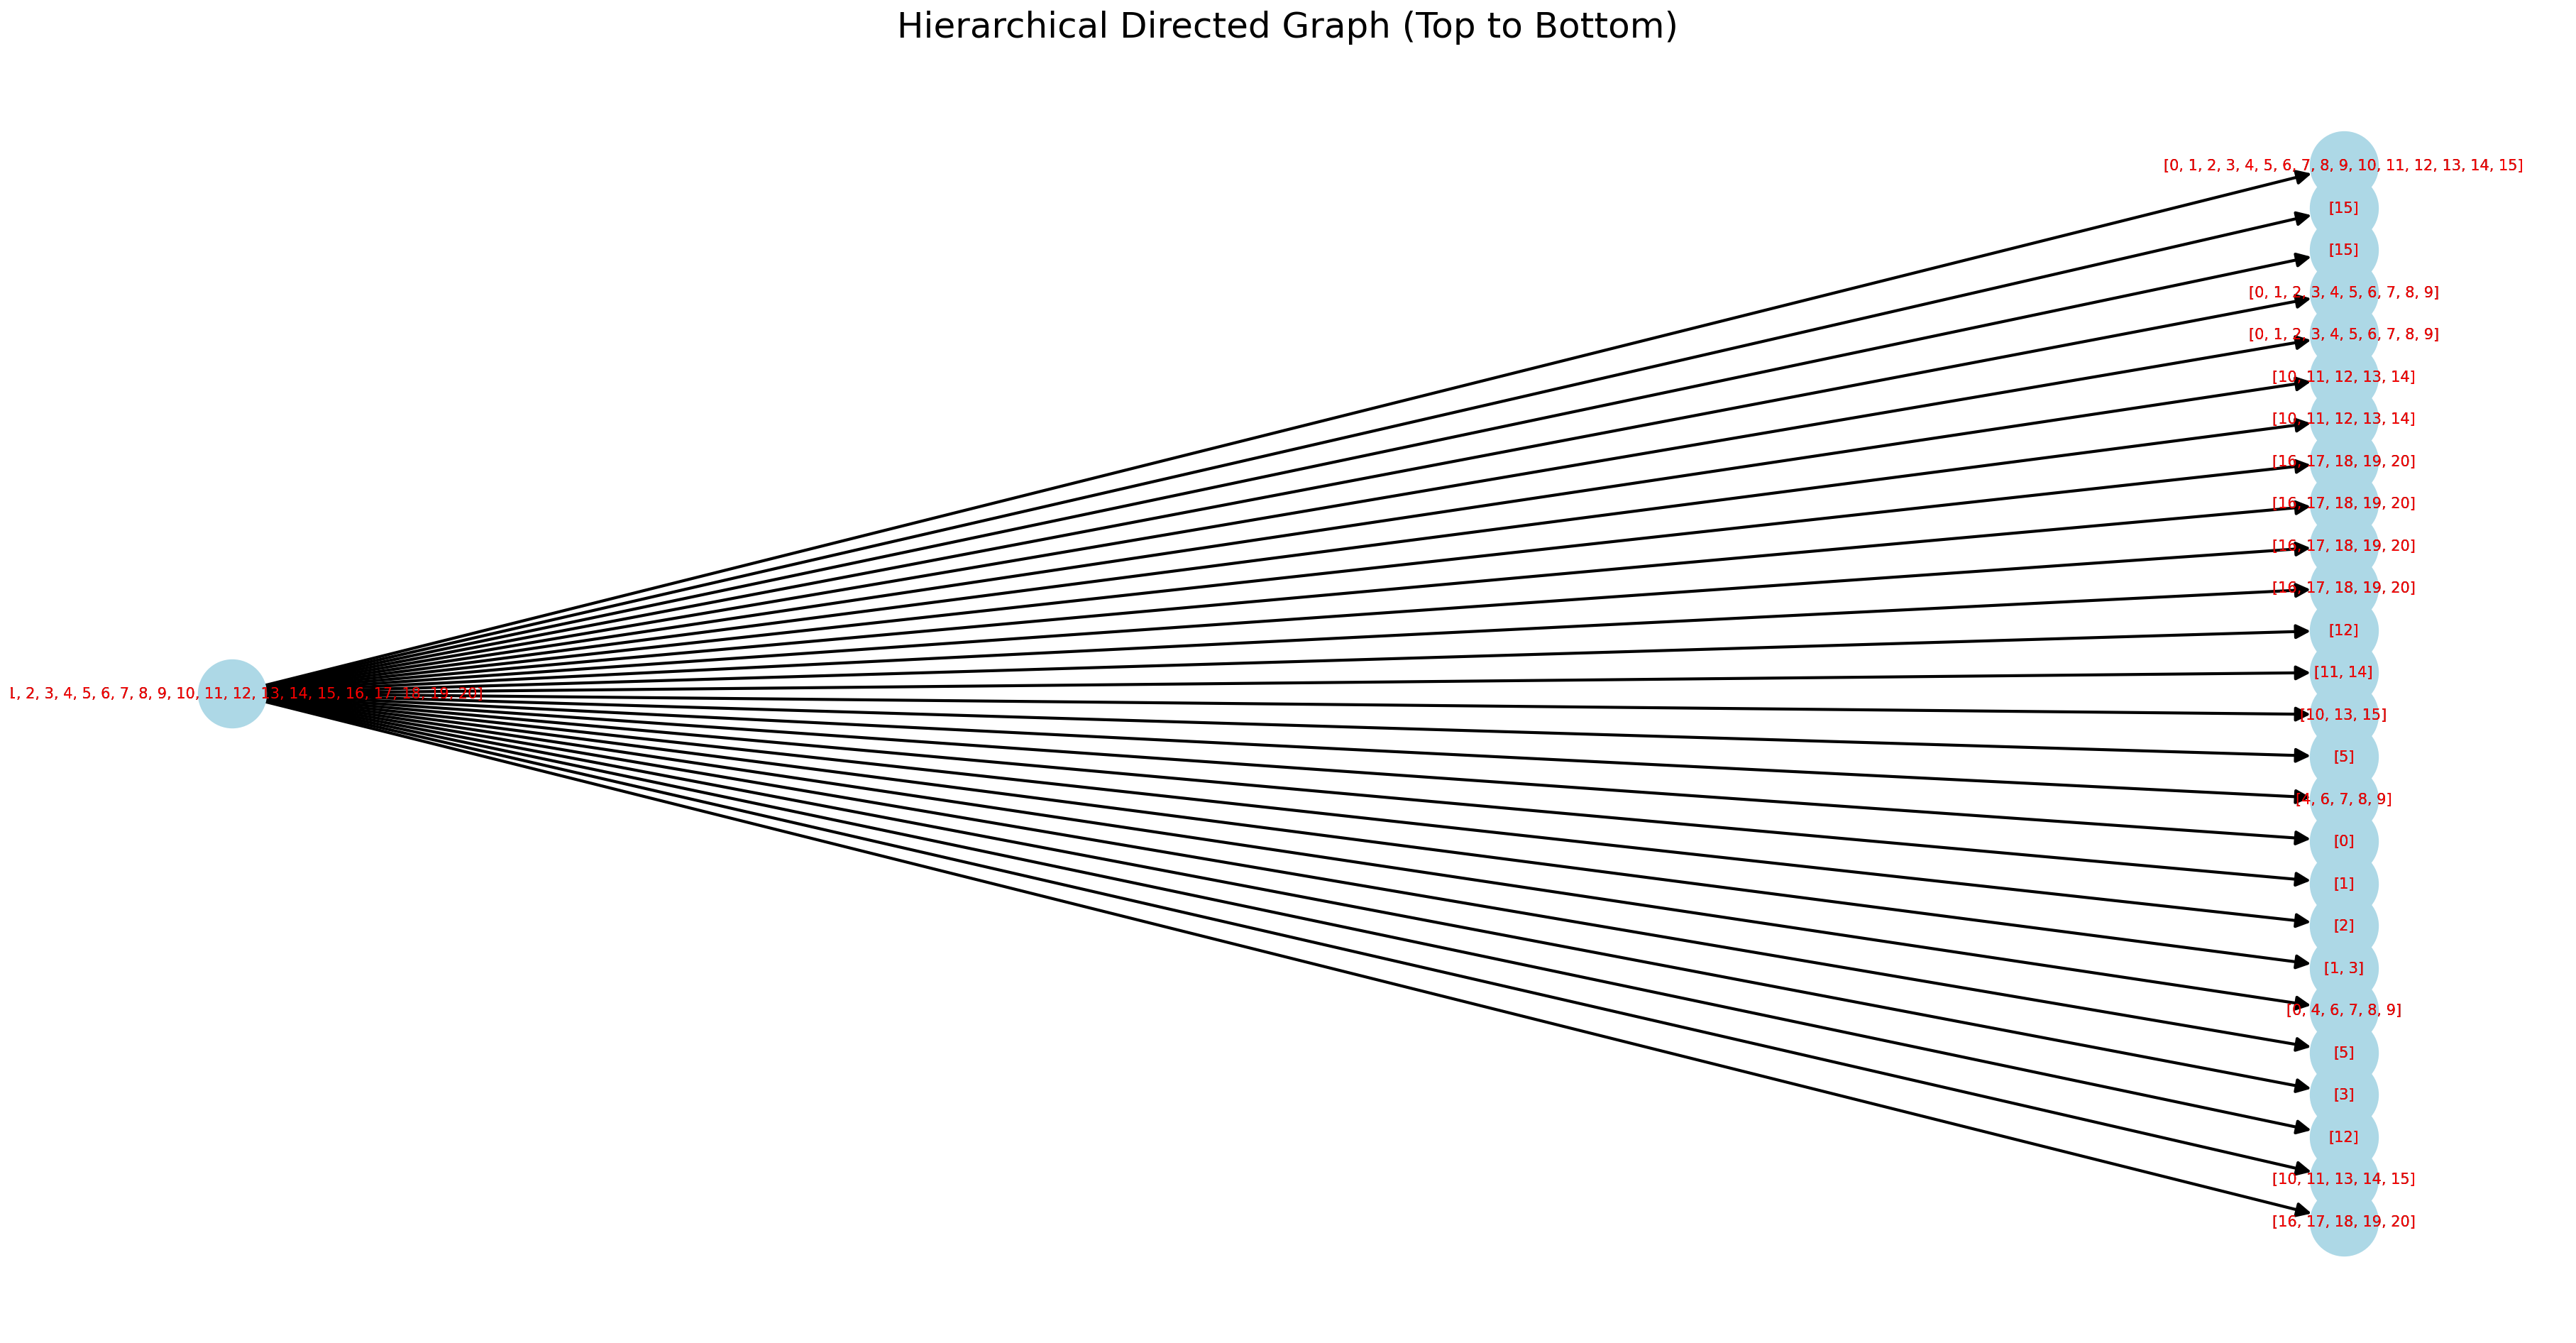
Hierarchical graph: We build a hierarchical directed graph where each level corresponds to blocks generated from a blocking rule/s.
Record Relationship graph: Two records in a block is referred as that they co-occur and this relationship is represented as an edge between these two records. We graph co-ocurrence and edges in a record relationship graph where we refer to records as nodes.
The generation of clustering components reduces all dataset record comparisons which is an O(n
Assuming 1000 records, from n*(n-1)/2 = 1000*999/2 = 499,500 comparisons without blocking
to
assuming 100 components evenly split with 10 records each, 10*9/2=45 comparisons per component
45 * 100 components = 4500

== That's over 110x reduction in comparisons ==
We conclude the results are encouraging and we identify multiple further research opportunities to improve our results.
The code for this repo is available in the Github repo.
Visit here this project's github code repo DeepWiki Page structured AI-generated documentation of the code repo.
Short video with code execution:
We generate an imaginary dataset by creating different brands of pianos and selecting features that require normalization with different methods, including numeric, dates and ordinal and boolean categorical. he piano model names are purposefully omitted in the dataset to test record linkage within brands for different models without the model name feature.
Typos for the features of the dataset have been added to challenge the approach.
We then compare the resulting entity component clusters to the expected results when we created the dataset.
The dataset is small and holds twenty records and it is sufficient for an initial indication of the potential of this approach.
Sample Dataset:
| # | Name | Tension_Adj | Tension | Resonance | Longevity | Quality | Amt_Sold |
|---|---|---|---|---|---|---|---|
| 0 | Apollo | 1 | 3.051514 | 110.993063 | 13/04/2028 | 0 | 5000 |
| 1 | Apolo | 1 | 3.5 | 108.5 | 13/03/2028 | 1 | 5000 |
| 2 | Apo | 1 | 3.051514 | 109.25 | 13/04/2028 | 0 | 5000 |
| 3 | Apol | 1 | 3.05 | 11.09 | 13/04/2029 | 0 | 4000 |
| 4 | Apollo | 1 | 3.5 | 109.75 | 03/04/2028 | 0 | 4500 |
| 5 | Apollorium | 0 | 6.25 | 92 | 24/08/2033 | 1 | 2500 |
| 6 | Apollo | 0 | 2.627367 | 96.071012 | 24/09/2025 | 1 | 3000 |
| 7 | Apollo | 0 | 2.627367 | 99 | 02/08/2025 | 1 | 3000 |
| 8 | Apollo | 0 | 2.327367 | 95 | 24/08/2025 | 1 | 3000 |
| 9 | Apollo | 0 | 2.6 | 95.5 | 24/08/2025 | 1 | 3000 |
| 10 | August FÖrster | 0 | 11.670953 | 119.348834 | 09/12/2030 | 3 | 5000 |
| 11 | August Forster | 1 | 11.6 | 117 | 08/12/2030 | 3 | 5000 |
| 12 | August F | 1 | 116 | 118 | 09/11/2030 | 3 | 5000 |
| 13 | August FÖrster | 0 | 1.6 | 119 | 08/11/2030 | 2 | 5000 |
| 14 | August Forster | 0 | 6 | 105.75 | 03/11/2025 | 3 | 5000 |
| 15 | Agust FÖrster | 0 | 12.670953 | 121 | 09/12/2029 | 3 | 3000 |
| 16 | Baldwin | 1 | 0.386124 | 116.575368 | 11/08/2026 | 8 | 15000 |
| 17 | Baldwin | 1 | 1.386124 | 115 | 09/08/2026 | 7 | 15000 |
| 18 | Baldwin | 1 | 0.3 | 116.1 | 10/07/2026 | 8 | 5000 |
| 19 | Baldwin | 1 | 1.3 | 117 | 10/08/2025 | 8 | 50000 |
| 20 | Baldwin | 1 | 1.3 | 116.575368 | 11/08/2026 | 6 | 500 |
We create a dataset where record features have multiple typos and differences. This helps us assess the robustness of the clustering approach.
We classify ground truth for records in each component.
Our complete labelled piano dataset contains 3 brands (Apollo, August Förster, Baldwin) and 2 unclassified records that may therefore be a different brand.
Moreover, the dataset contains 4 models identified for each brand (2 models of Apollo, 1 August Förster, 1 Baldwin), and the 2 unclassified models mentioned above.
Viewed in a graph, we find the following subsets of a graph, referred herein as components:
ground_truth_pairs_component_0 = [(0, 1), (0, 2), (0, 3), (0, 4), (1, 2), (1, 3), (1, 4), (2, 3), (2, 4), (3, 4),
                        (6, 7), (6, 8), (6, 9), (7, 8), (7, 9), (8, 9)]
singleton = [5]
ground_truth_pairs_component_1 = true_pairs_component_1 = [(10, 11), (10, 12), (10, 13), (10, 15), (11, 12), (11, 13), (11, 15), (12, 13), (12, 15), (13, 15)]
singleton = [14]
ground_truth_pairs_component_2 = true_pairs_component_1 = [(16, 17), (16, 18), (16, 19), (16, 20), (17, 18), (17, 19), (17, 20), (18, 19), (18, 20), (19, 20)]
singleton = [ ]
We create blocks with a lenient phonetic rule applied to the dataset's piano model names. Records are clustered in the blocks where they match any of the rules - the first char, first two char, the first three char, last three char or has all consonants.
Rules are easily extendable and can be arranged to generate blocks in a hierarchical or flat order. For example, we can block feature name at the first graph hierarchical level for the rule phonetic_combination which generates flat blocks for multiple sub-rules ("first_char", "first_two_char", "first_three_char", "last_three_char", "consonants"), and generate the second level graph blocks from the first for feature date for a temporal sliding_window rule.
Blocking rules can easily be extended to experiment with new business rules, adopt new ones or facotr in edge cases:
{
  "rules": {
    "phonetic_combination": {
      "type": "text",
      "params": {
        "algorithms": [
          "first_char", "first_two_char", "first_three_char", "last_three_char", "consonants"
        ]
      },
      "default": false,
      "description": "multi-method name blocking"
    },
    "sliding_window": {
            "type": "temporal",
            "params": {"window_days": 7},
            "default": false,
            "description": "7-day sliding window blocks"
        }
  }
}
def _phonetic_combination(self, feature_series: pd.Series, method_params:dict, feature_name:str) -> pd.Series:

        def encode_combo(x):
            key_list = []
            if "first_char" in method_params["algorithms"]:
                key_list.append(str(x).lower()[0:1])

            if "first_two_char" in method_params["algorithms"]:
                key_list.append(str(x).lower()[0:2])

            if "first_three_char" in method_params["algorithms"]:
                key_list.append(str(x).lower()[0:3])

            if "last_three_char" in method_params["algorithms"]:
                key_list.append(str(x).lower()[-3:])

            if "consonants" in method_params["algorithms"]:
                key_list.append(''.join([c for c in str(x).lower() if c.isalpha() and c not in 'aeiou']))

            return key_list

        return feature_series.apply(encode_combo)
This is an example of a block that is created from the first three letters of a brand name:
Block Key initial_block-name_phonetic_combination:ap
        Block Hierarchy Level: 1
        Block Feature: name
        Block Parent Key: initial_block
        Block Key: initial_block-name_phonetic_combination:ap
        Leaf Key: phonetic_combination:ap
        Block Rule: phonetic_combination
        Block Record Indices: [0, 1, 2, 3, 4, 5, 6, 7, 8, 9]
This tree graph shows the blocks in a graph where each record lands:

We will not use this graph in this experiment, but as an example, this is how a two level graph with a second rule may look like. Due to the multiple blocks involved, these are visually a bit mushed together in the snapshot:
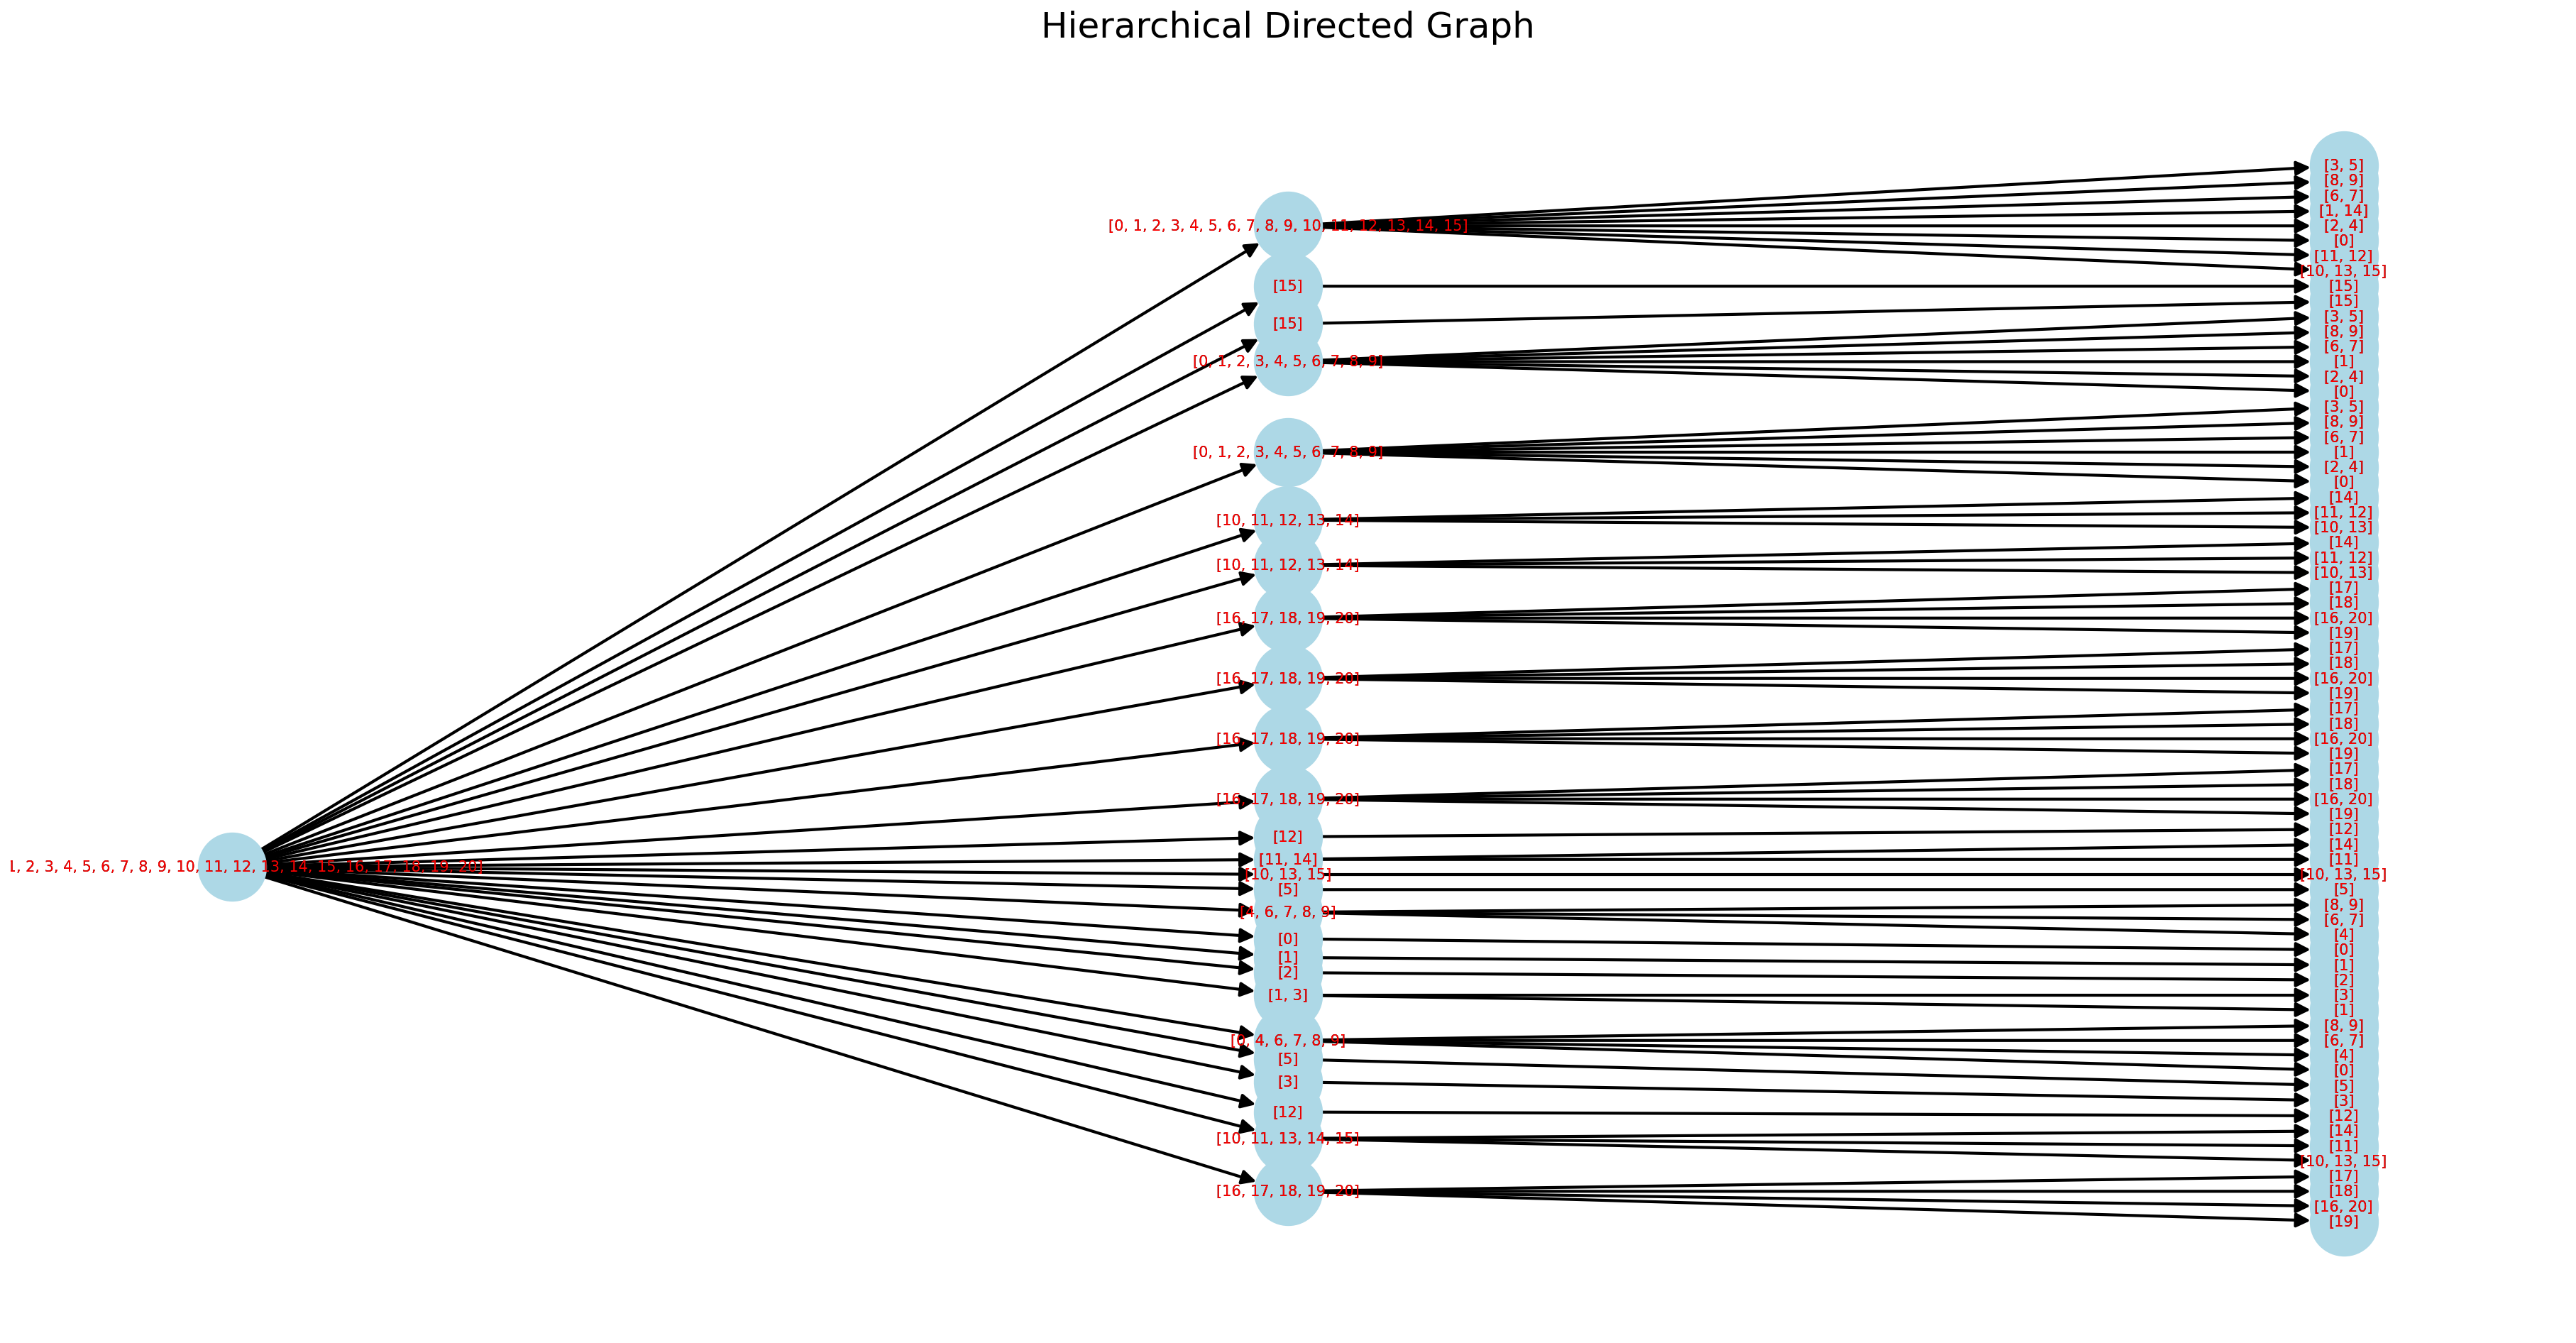
Two records in a block (e.g. as per a blocking rule, they both have the first three letters in the name) is referred as that they co-occur. If records match on multiple rules they'll co-ocur on multiple blocks. Therefore records can have multiple connections to other records as they co-ocur in multiple blocks.
We represent record blocking relationships in a second graph we coin record relationsihp graph. Here each record is a node and each co-ocurrence between records represents an edge between the records. In this record relationship graph, components are formed when a group of nodes are all connected to each other, either directly, or indirectly through other nodes.
We track block provenance so that each time two records co-occur in the same block, their edge weight increases by 1. This weight metric signals the strength of a relationship between records. Records whose edge weight is above a certain threshold form a graph component.
Similarly, experimenting with blocking rules can help avoid co-ocurrence on different brand names (e.g. Apollo and Baldwin), so that each name creates their own graph component. The numbers on the edge shown below tells us how many times records co-ocur in the graph.
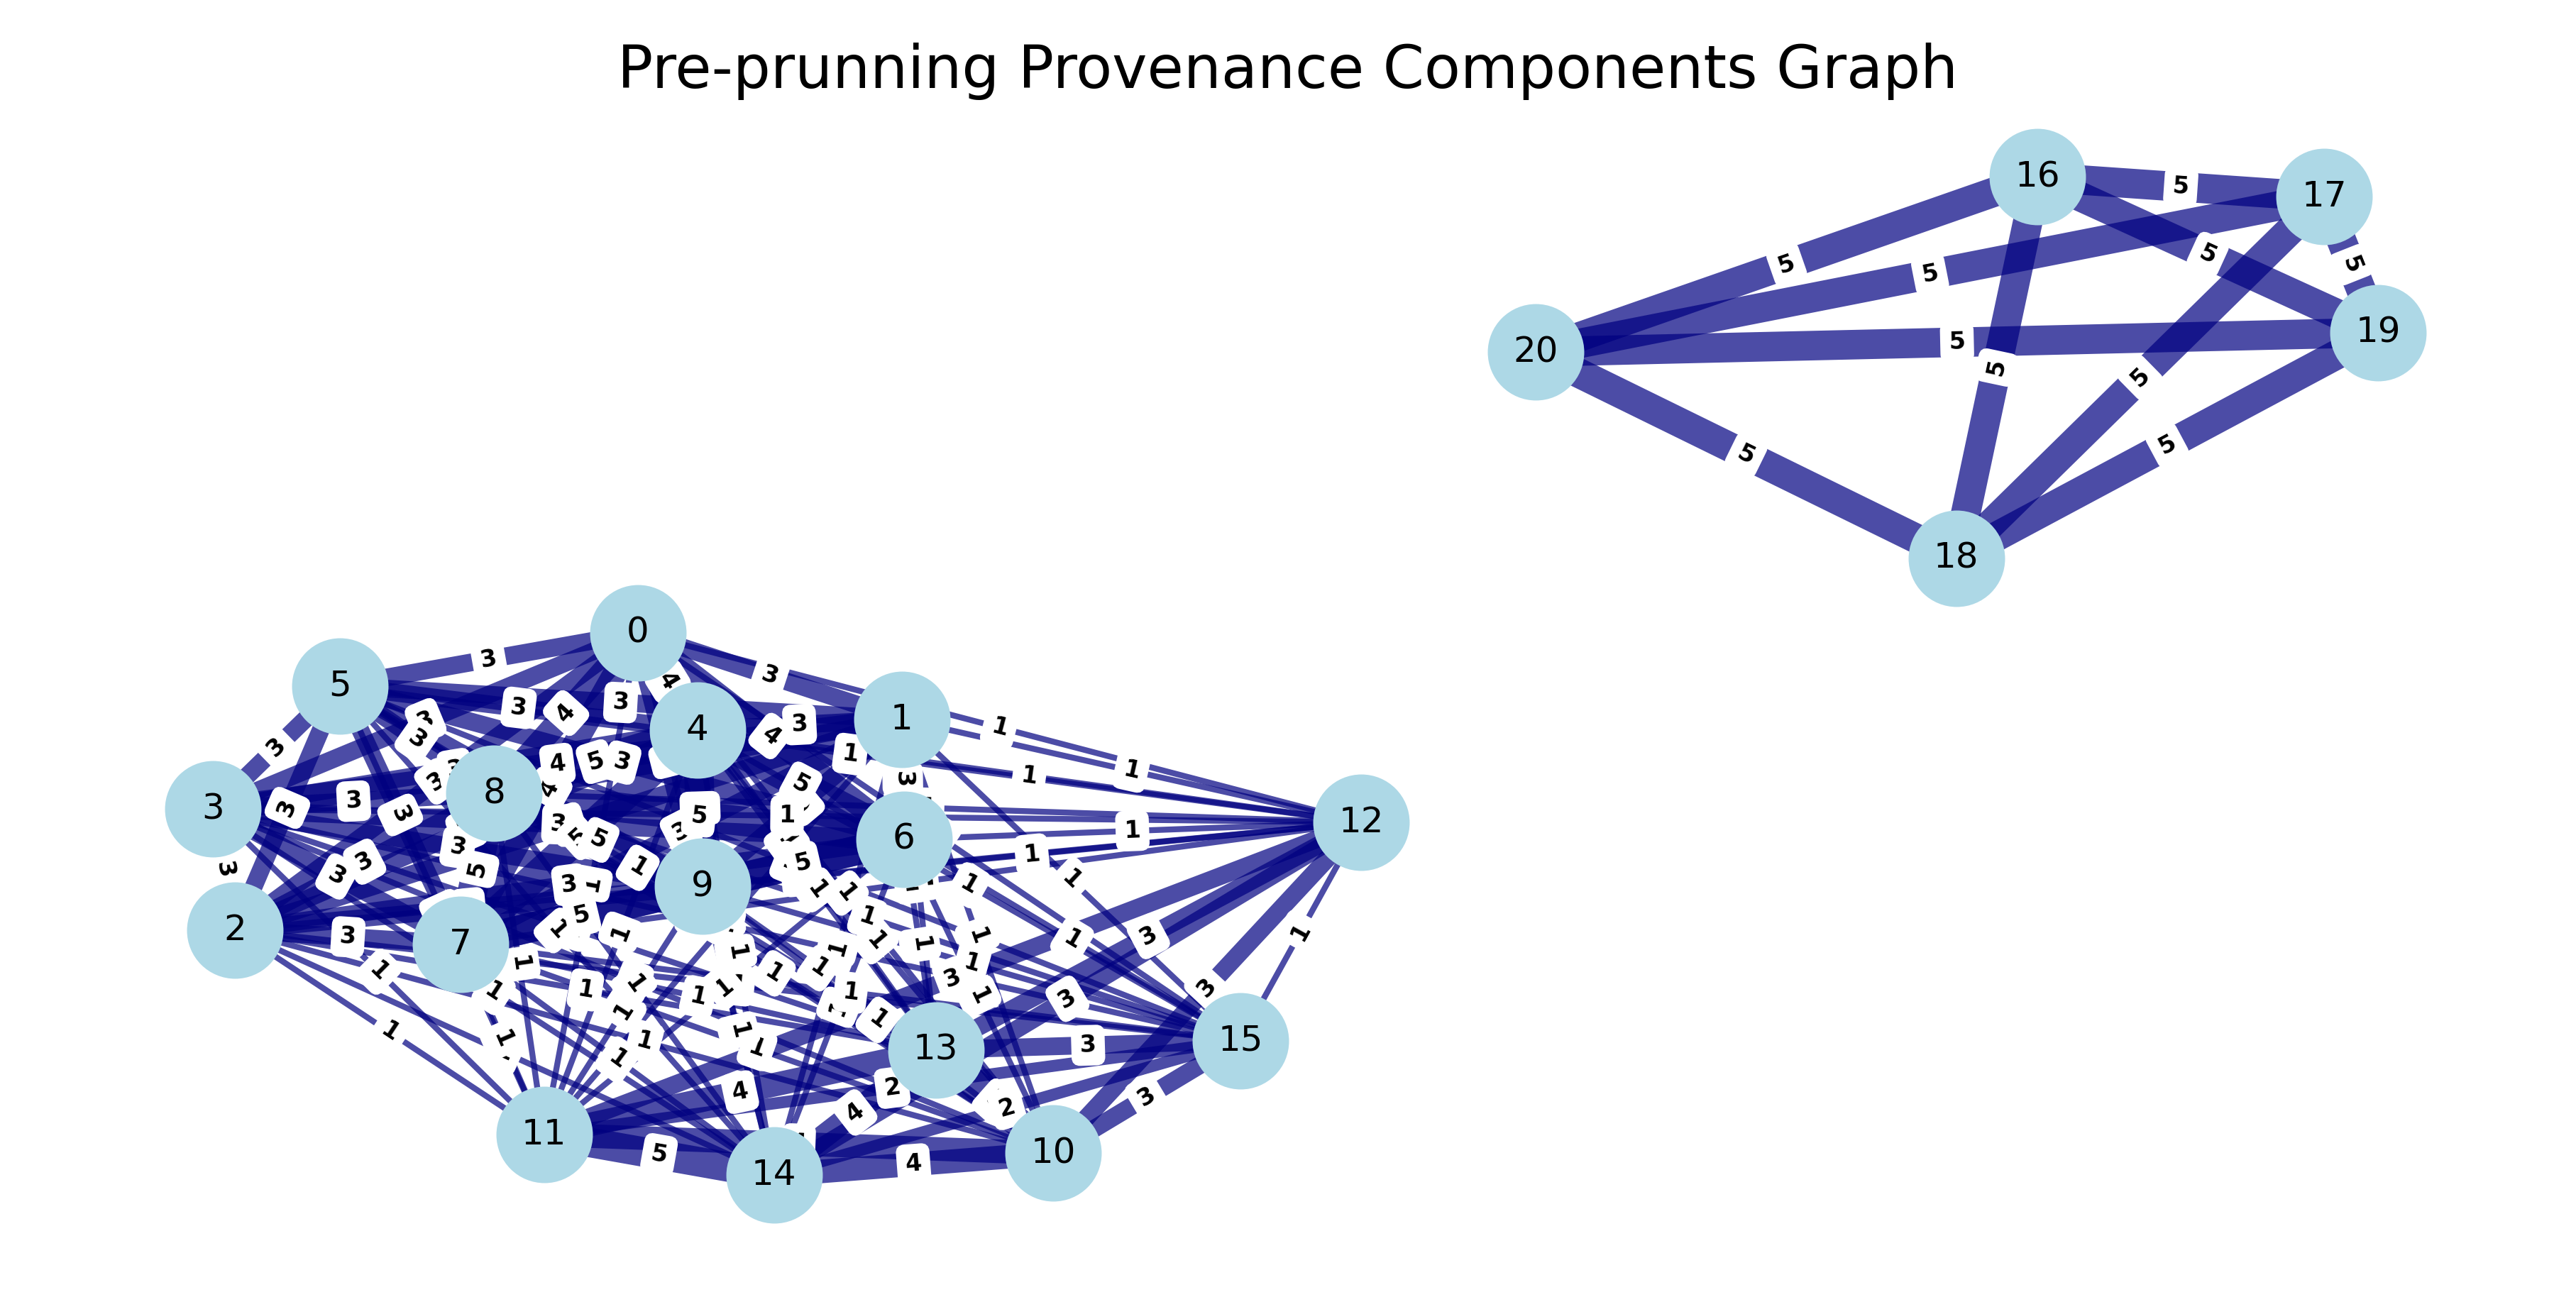
We can make the assumption that two records that co-occur in exactly one block throughout the graph is not sufficient to signal that they are closely related and belong to the same component. In this project, we set the number of required edges to be >=2 for records to be part of the same component.
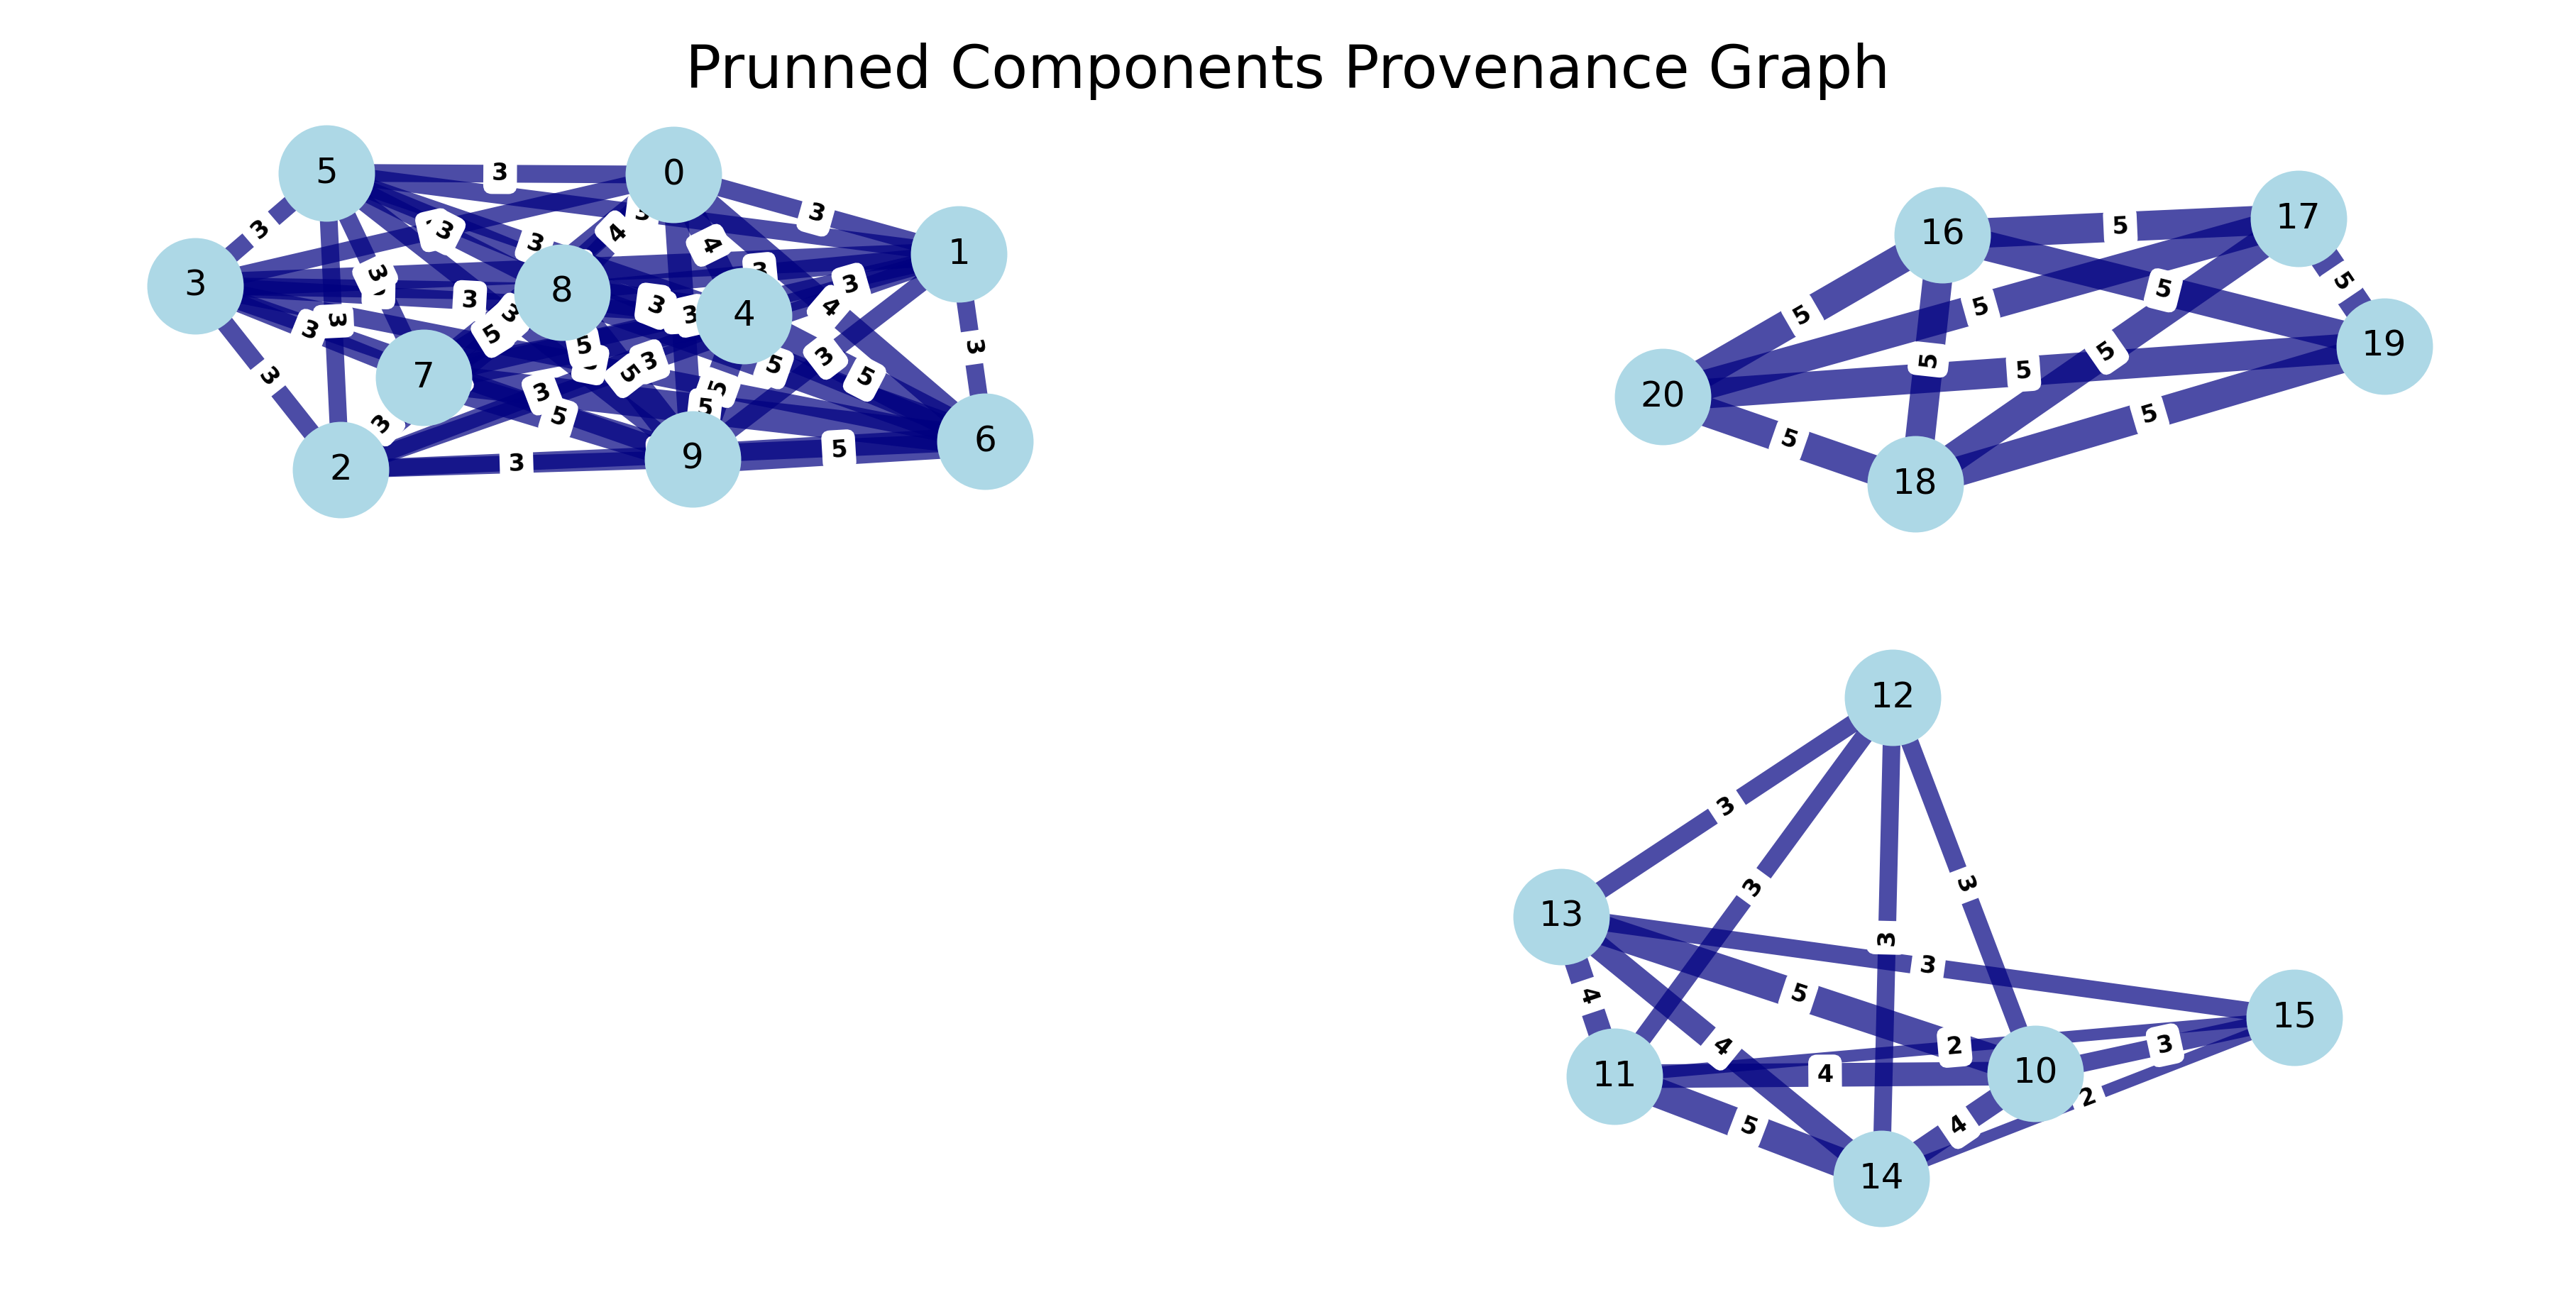
The resulting components from re-arranging nodes according to the number of node edge connections or weights produces a component for all Apollo brand records and its variations. Two further components are generated for piano models of the brands August Forster and Baldwin.
At this point however, the certainty that these records belong to a brand or are instances of the same model is limited to discrete blocking rules and an edge count threshold. An algorithmic approach that leverages all record features will enable us to cluster records with some desired level of certainty. Fortunately, also at this point the placement of records in components reduces the comparison space from O(n
Additional rules can be added to block further, but its discrete approach risks overfitting. Here, there may be scope for further research that may yield interesting results by selecting blocking rules, their hierarchical order and alter rule values (e.g. number of bins, sampling such as np.linspace, np.logspace, etc) with bayesian optimization.
Recap: We initially broke out records into components by taking a blocking approach that operates in discrete space and by generating sparse blocks. We do not block further at the risk of overfitting.
Instead, for each component, we generate dense clusters using the k-means algorithm which operates on transformed numerical features in continuous space. This approach enables us to map similar items to the same bucket based on minimizing the distance to initially randomly initialized cluster centroids:
We create a multi-dimensional feature representation by transforming each feature into numerical vectors and constructing a single feature array:
We manually weight each resulting transformed feature vector to better fit the KLSH clustering results to our dataset's ground truth. At a later stage in our project, these weights are optimized with bayesian optimization.
The algorithm iteratively assigns each record in a component to its nearest centroid based on euclidean distance, recalculate the centroids using the means of all its assigned records and repeat this until we reach converge. This approach helps us group similar records to a cluster where we minimize the sum of squared distances between records and the centroid. Finally, we select the k cluster result output from the algorithm by considering F1, silhouette scores and the elbow method results.
This approach results in a separation of piano models within components and therefore piano brands.
The above mentioned method helps us group the Apollo records into the two separate entities.
Let's analyze Component Zero
We transform numeric data to be used by Kmeans for the first component with record indices {0, 1, 2, 3, 4, 5, 6, 7, 8, 9}.
We run K-means for K=10 clusters:
== Final Clusters: ==
k=1:  {0: [0, 1, 2, 3, 4, 5, 6, 7, 8, 9]}
k=2:  {0: [3], 1: [0, 1, 2, 4, 5, 6, 7, 8, 9]}
k=3:  {0: [3], 1: [5, 6, 7, 8, 9], 2: [0, 1, 2, 4]}
k=4:  {0: [3], 1: [6, 7, 8, 9], 2: [0, 1, 2, 4], 3: [5]}
k=5:  {0: [3], 1: [6, 7, 8, 9], 2: [0, 1, 2], 3: [5], 4: [4]}
k=6:  {0: [3], 1: [6, 7, 8, 9], 2: [0, 2], 3: [5], 4: [4], 5: [1]}
k=7:  {0: [3], 1: [6, 7, 9], 2: [0, 2], 3: [5], 4: [4], 5: [1], 6: [8]}
k=8:  {0: [3], 1: [7], 2: [0, 2], 3: [5], 4: [4], 5: [1], 6: [8], 7: [6, 9]}
k=9:  {0: [3], 1: [7], 2: [0], 3: [5], 4: [4], 5: [1], 6: [8], 7: [6, 9], 8: [2]}
k=10:  {0: [3], 1: [7], 2: [0], 3: [5], 4: [4], 5: [1], 6: [8], 7: [9], 8: [2], 9: [6]}
A visual interpretation of the Elbow method suggests K=4; the KneeLocator library suggests K=1 or 4 (depending on omitting curve and direction)
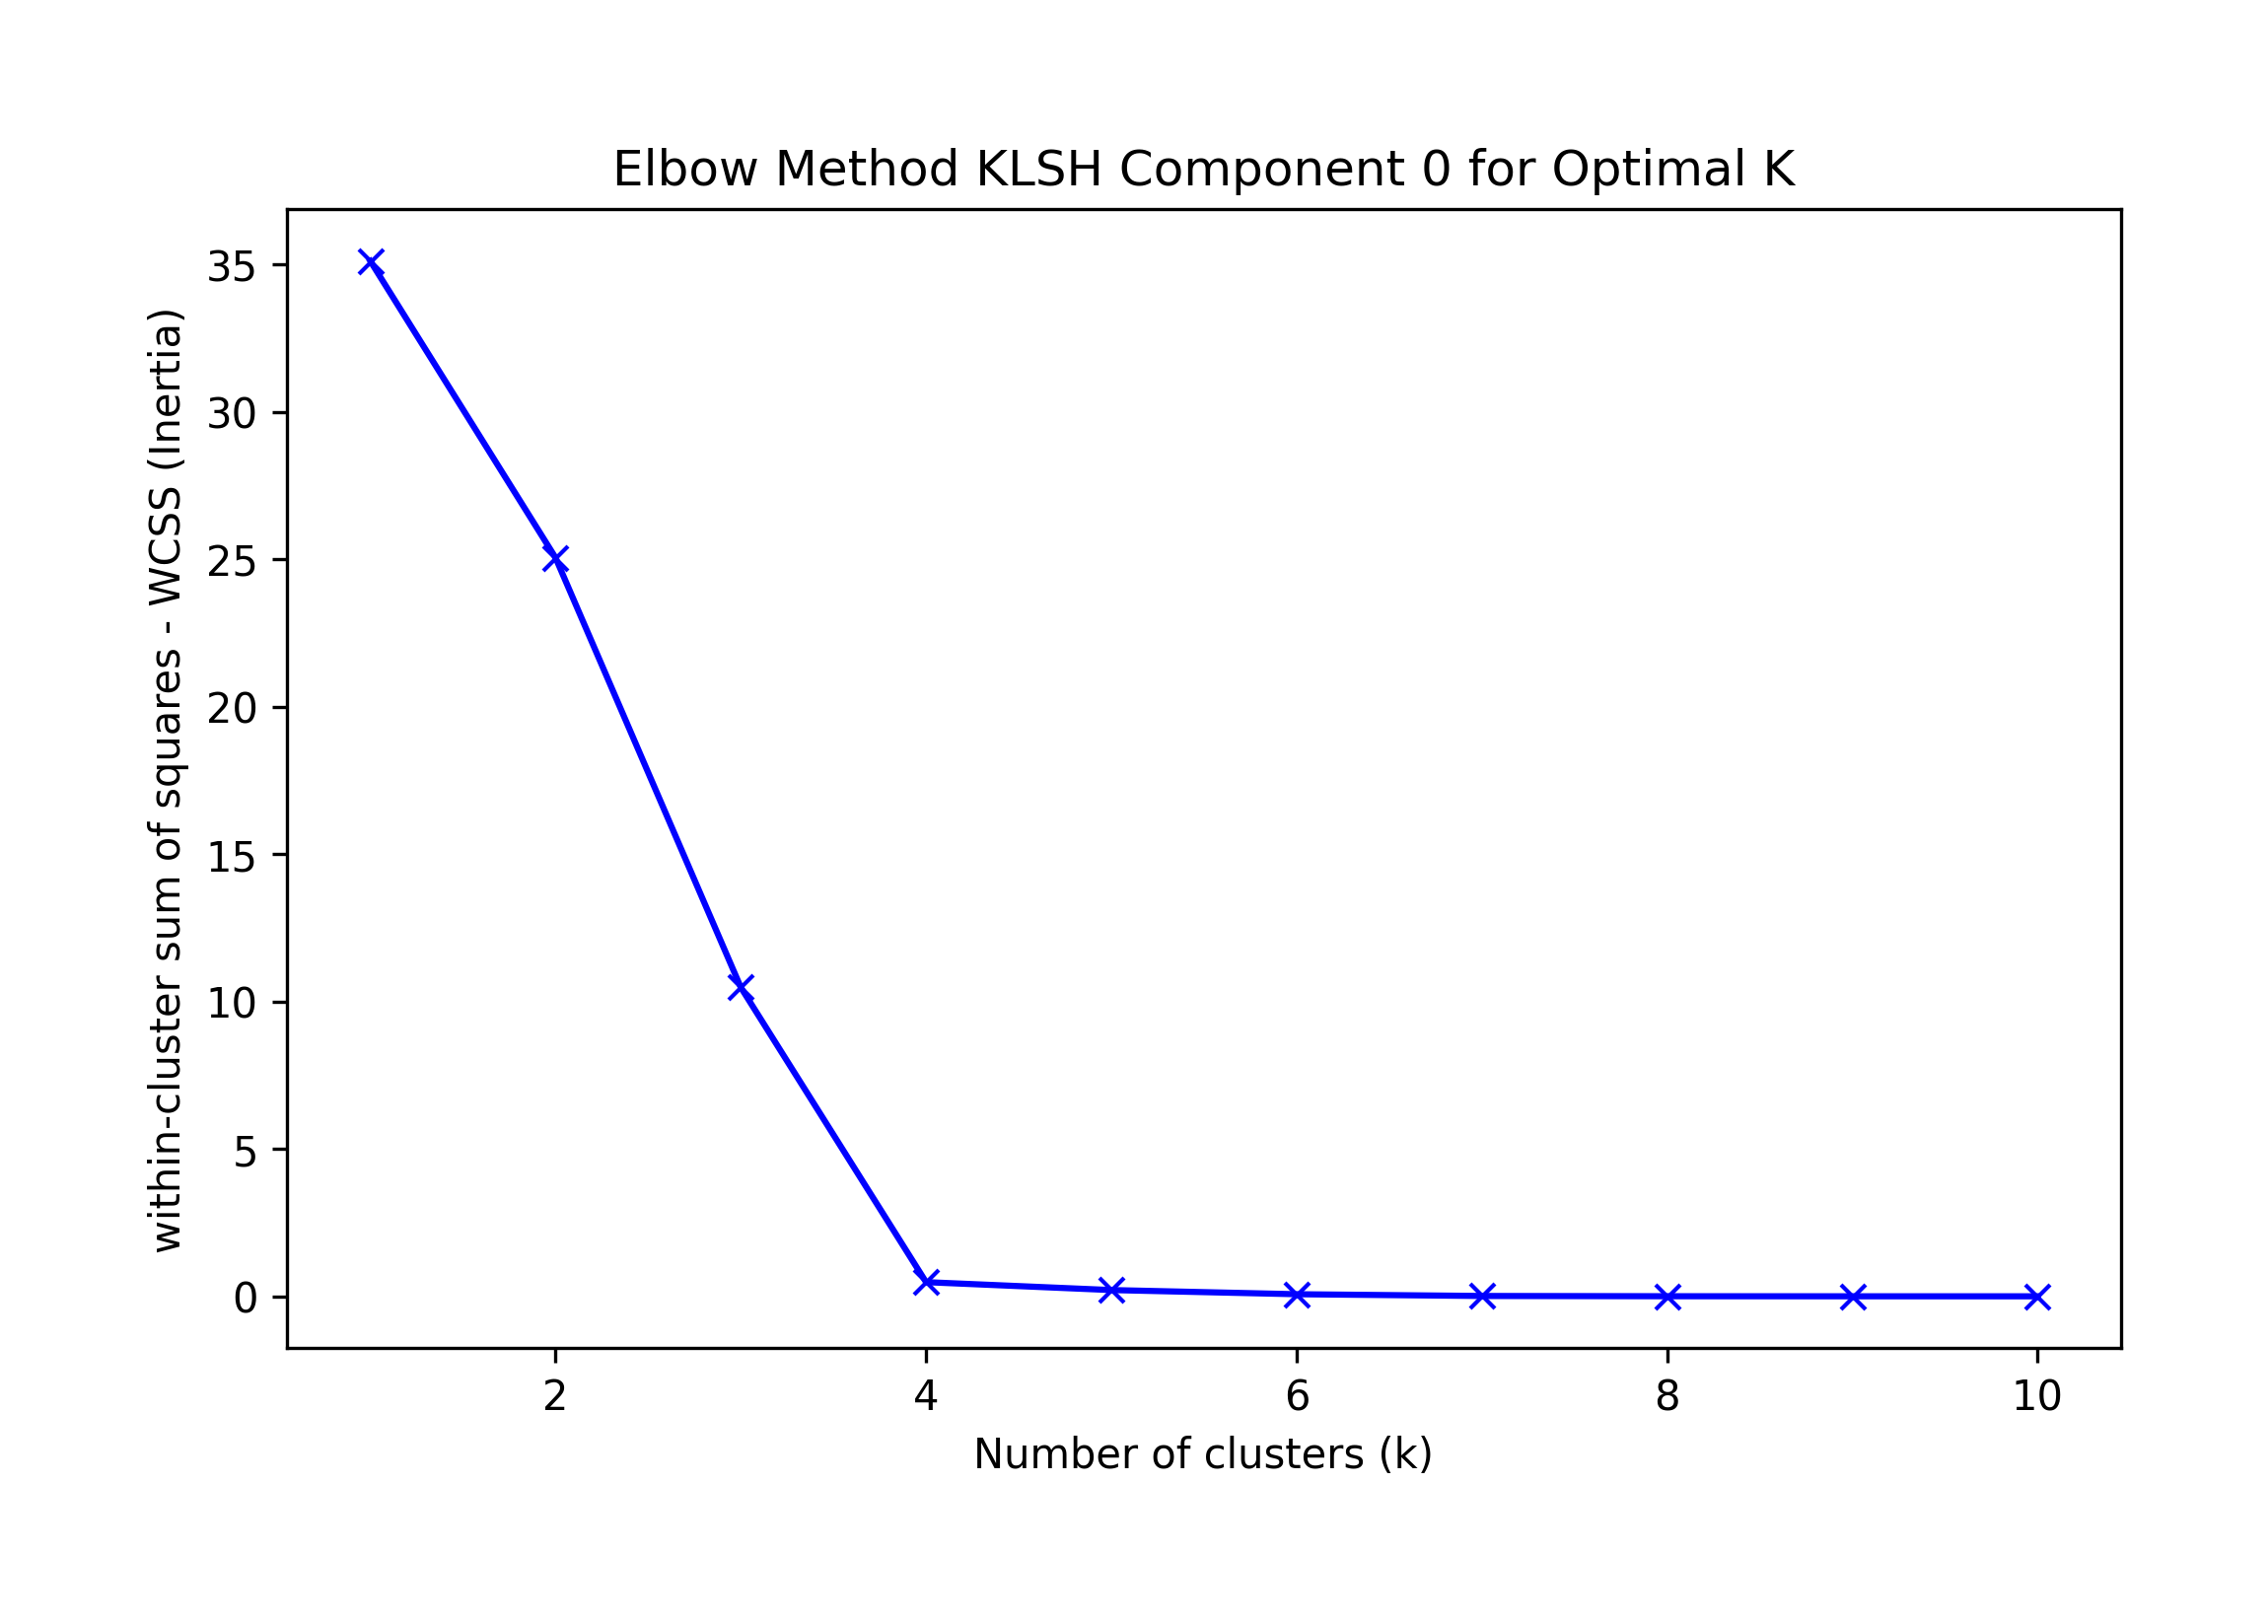
Sklearn's Silhouette method suggests K=4.
Best F-1 suggests K=4.
| K | F1 | Precision | Recall |
|---|---|---|---|
| 1 | 0.524590 | 0.355556 | 1.0000 |
| 2 | 0.461538 | 0.333333 | 0.7500 |
| 3 | 0.750000 | 0.750000 | 0.7500 |
| 4 | 0.857143 | 1.000000 | 0.7500 |
| 5 | 0.720000 | 1.000000 | 0.5625 |
| 6 | 0.608696 | 1.000000 | 0.4375 |
| 7 | 0.400000 | 1.000000 | 0.2500 |
| 8 | 0.222222 | 1.000000 | 0.1250 |
| 9 | 0.117647 | 1.000000 | 0.0625 |
| 10 | 0.000000 | 0.000000 | 0.0000 |
Thus, we choose the highest F-1 KMeans best result, k=4; the algorithm incorrectly classifies record 3 as a singleton:
k=4: {0: [3], 1: [6, 7, 8, 9], 2: [0, 1, 2, 4], 3: [5]}
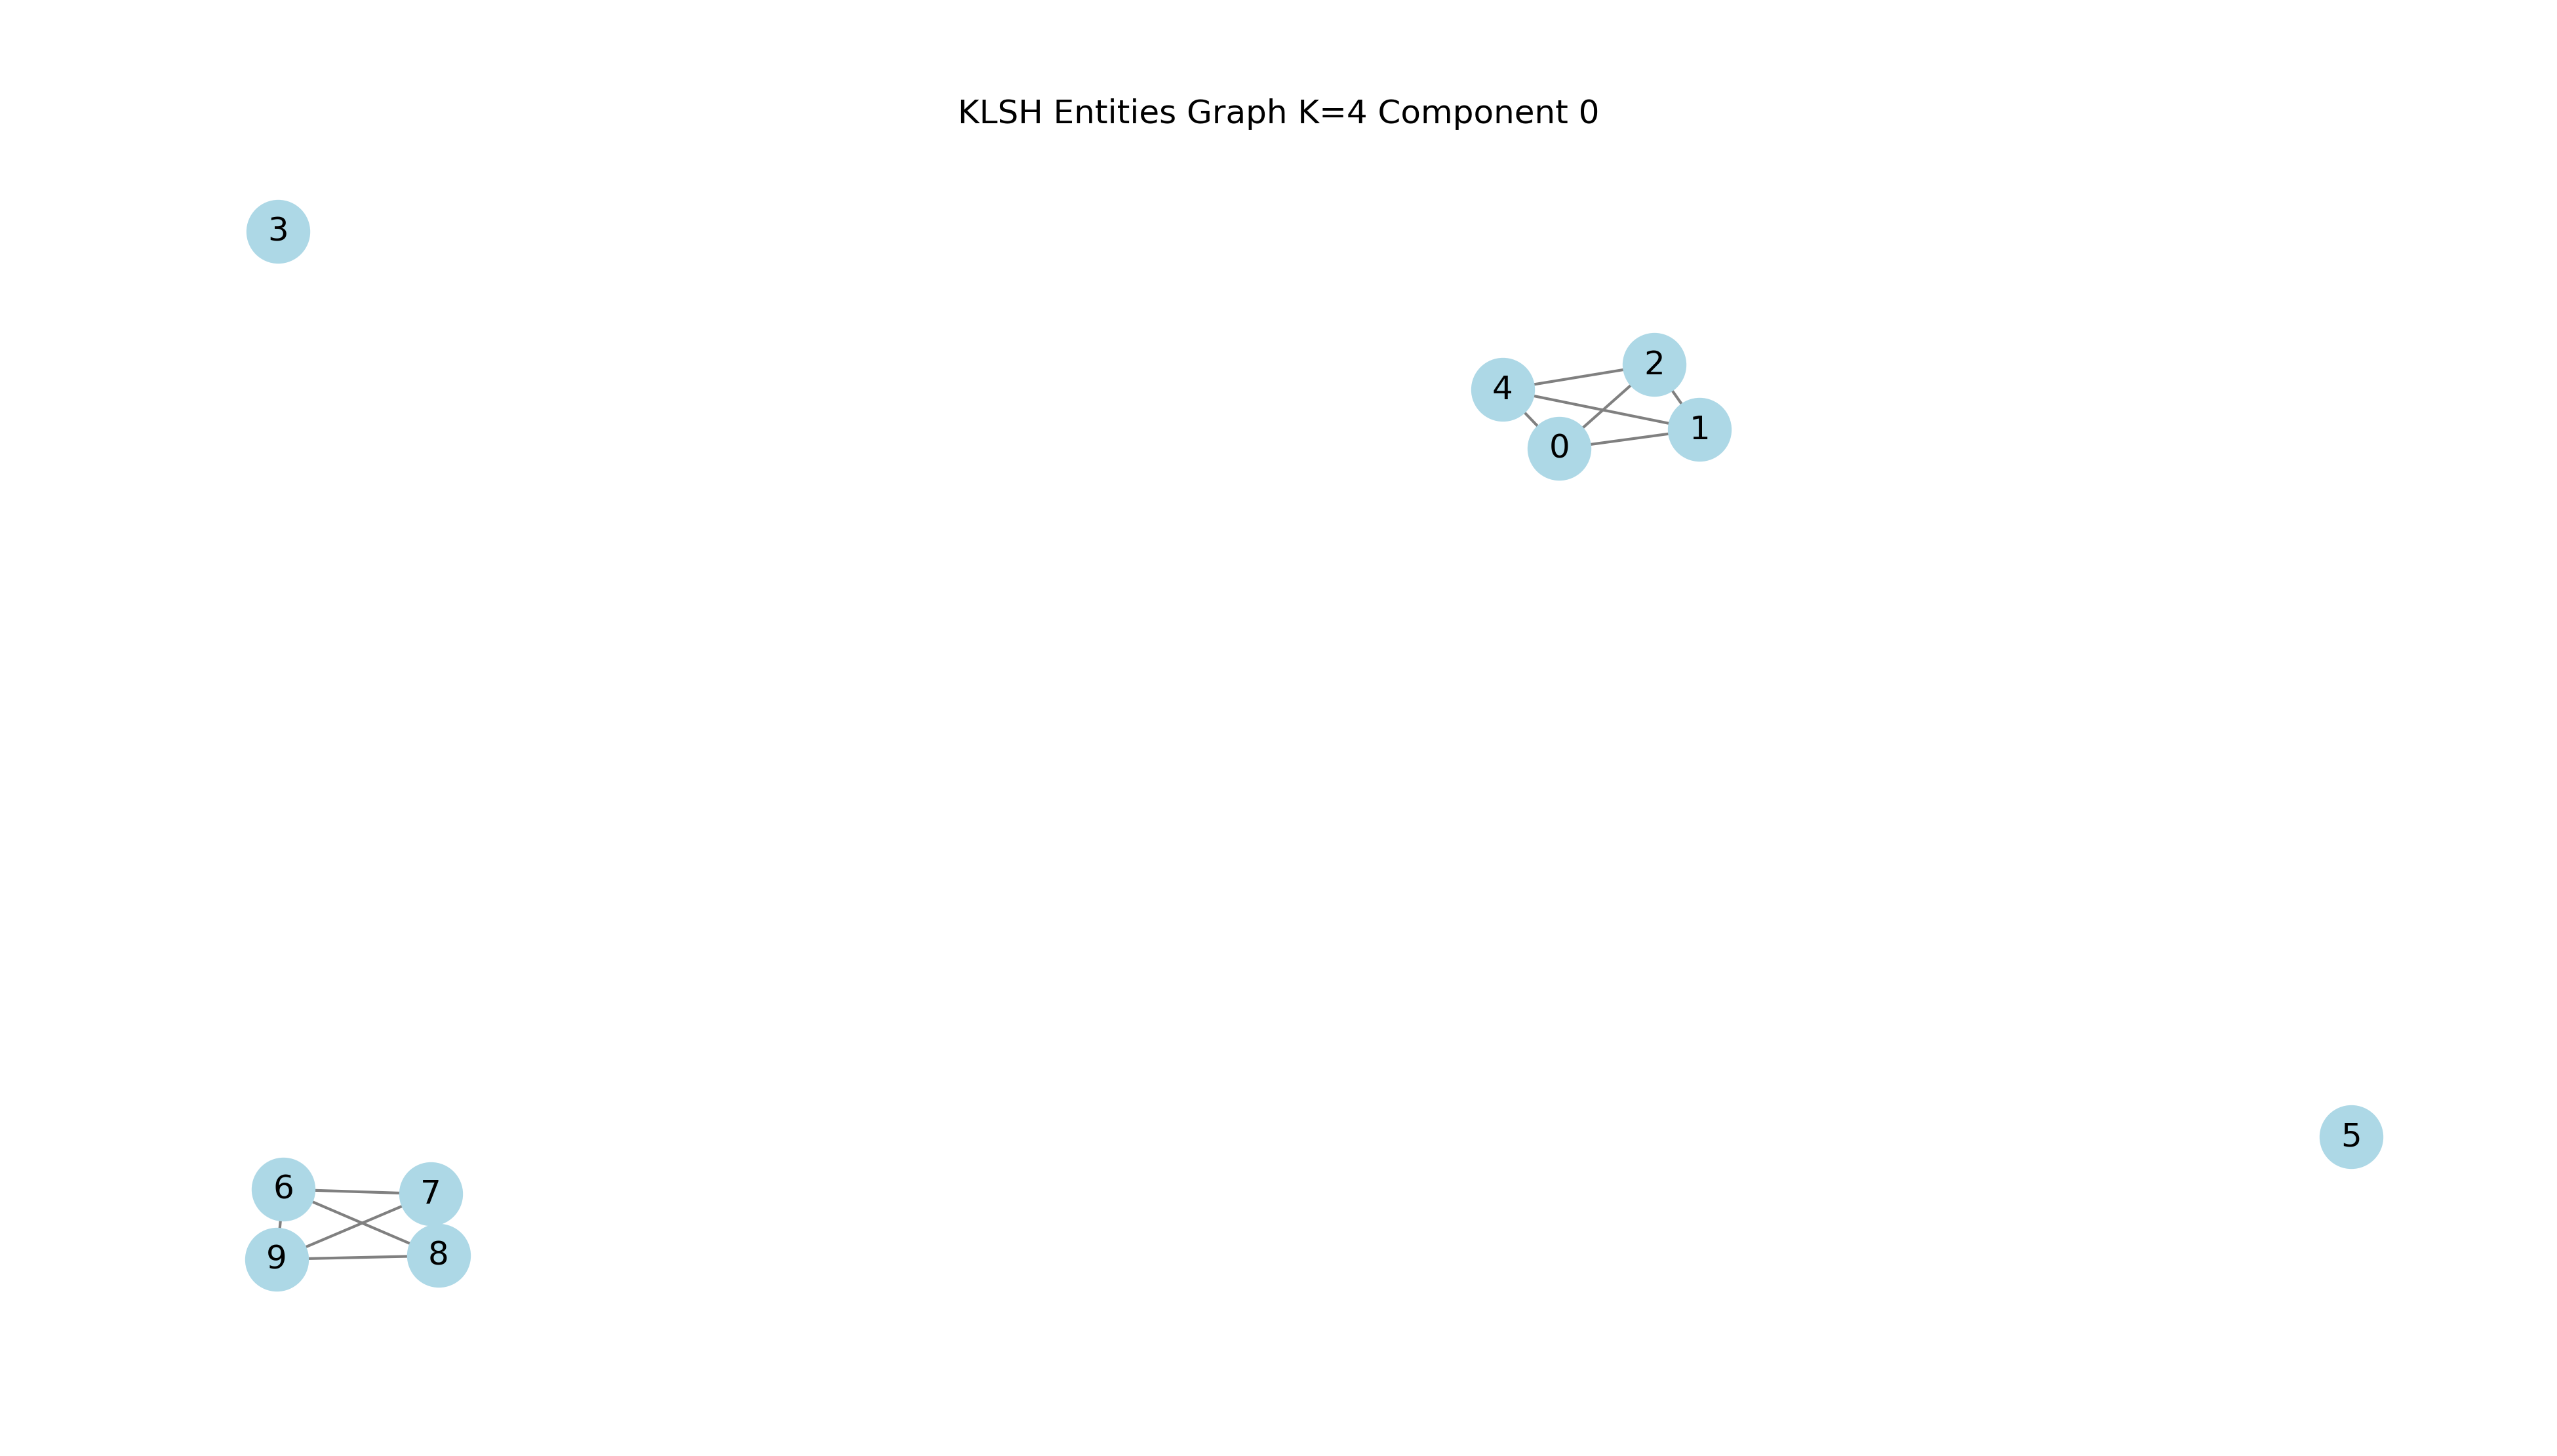
We run the equivalent unsupervised KMeans predictions for Component 1 and 2 with the following results:
Component 1:
== Final Clusters: ==
k=1:  {0: [10, 11, 12, 13, 14, 15]}
k=2:  {0: [11, 12, 14], 1: [10, 13, 15]}
k=3:  {0: [12], 1: [15], 2: [10, 11, 13, 14]}
k=4:  {0: [12], 1: [15], 2: [10, 11, 13], 3: [14]}
k=5:  {0: [12], 1: [15], 2: [10, 13], 3: [14], 4: [11]}
k=6:  {0: [12], 1: [15], 2: [10], 3: [14], 4: [11], 5: [13]}
Singletons: []
| K | F1 | Precision | Recall |
|---|---|---|---|
| 1 | 0.800000 | 0.666667 | 1.0000 |
| 2 | 0.500000 | 0.666667 | 0.4000 |
| 3 | 0.375000 | 0.500000 | 0.3000 |
| 4 | 0.461538 | 1.000000 | 0.3000 |
| 5 | 0.181818 | 1.000000 | 0.1000 |
| 6 | 0.000000 | 0.000000 | 0.0000 |
Elbow K is hard to tell, suggested KneeLocator K=1 or 4.
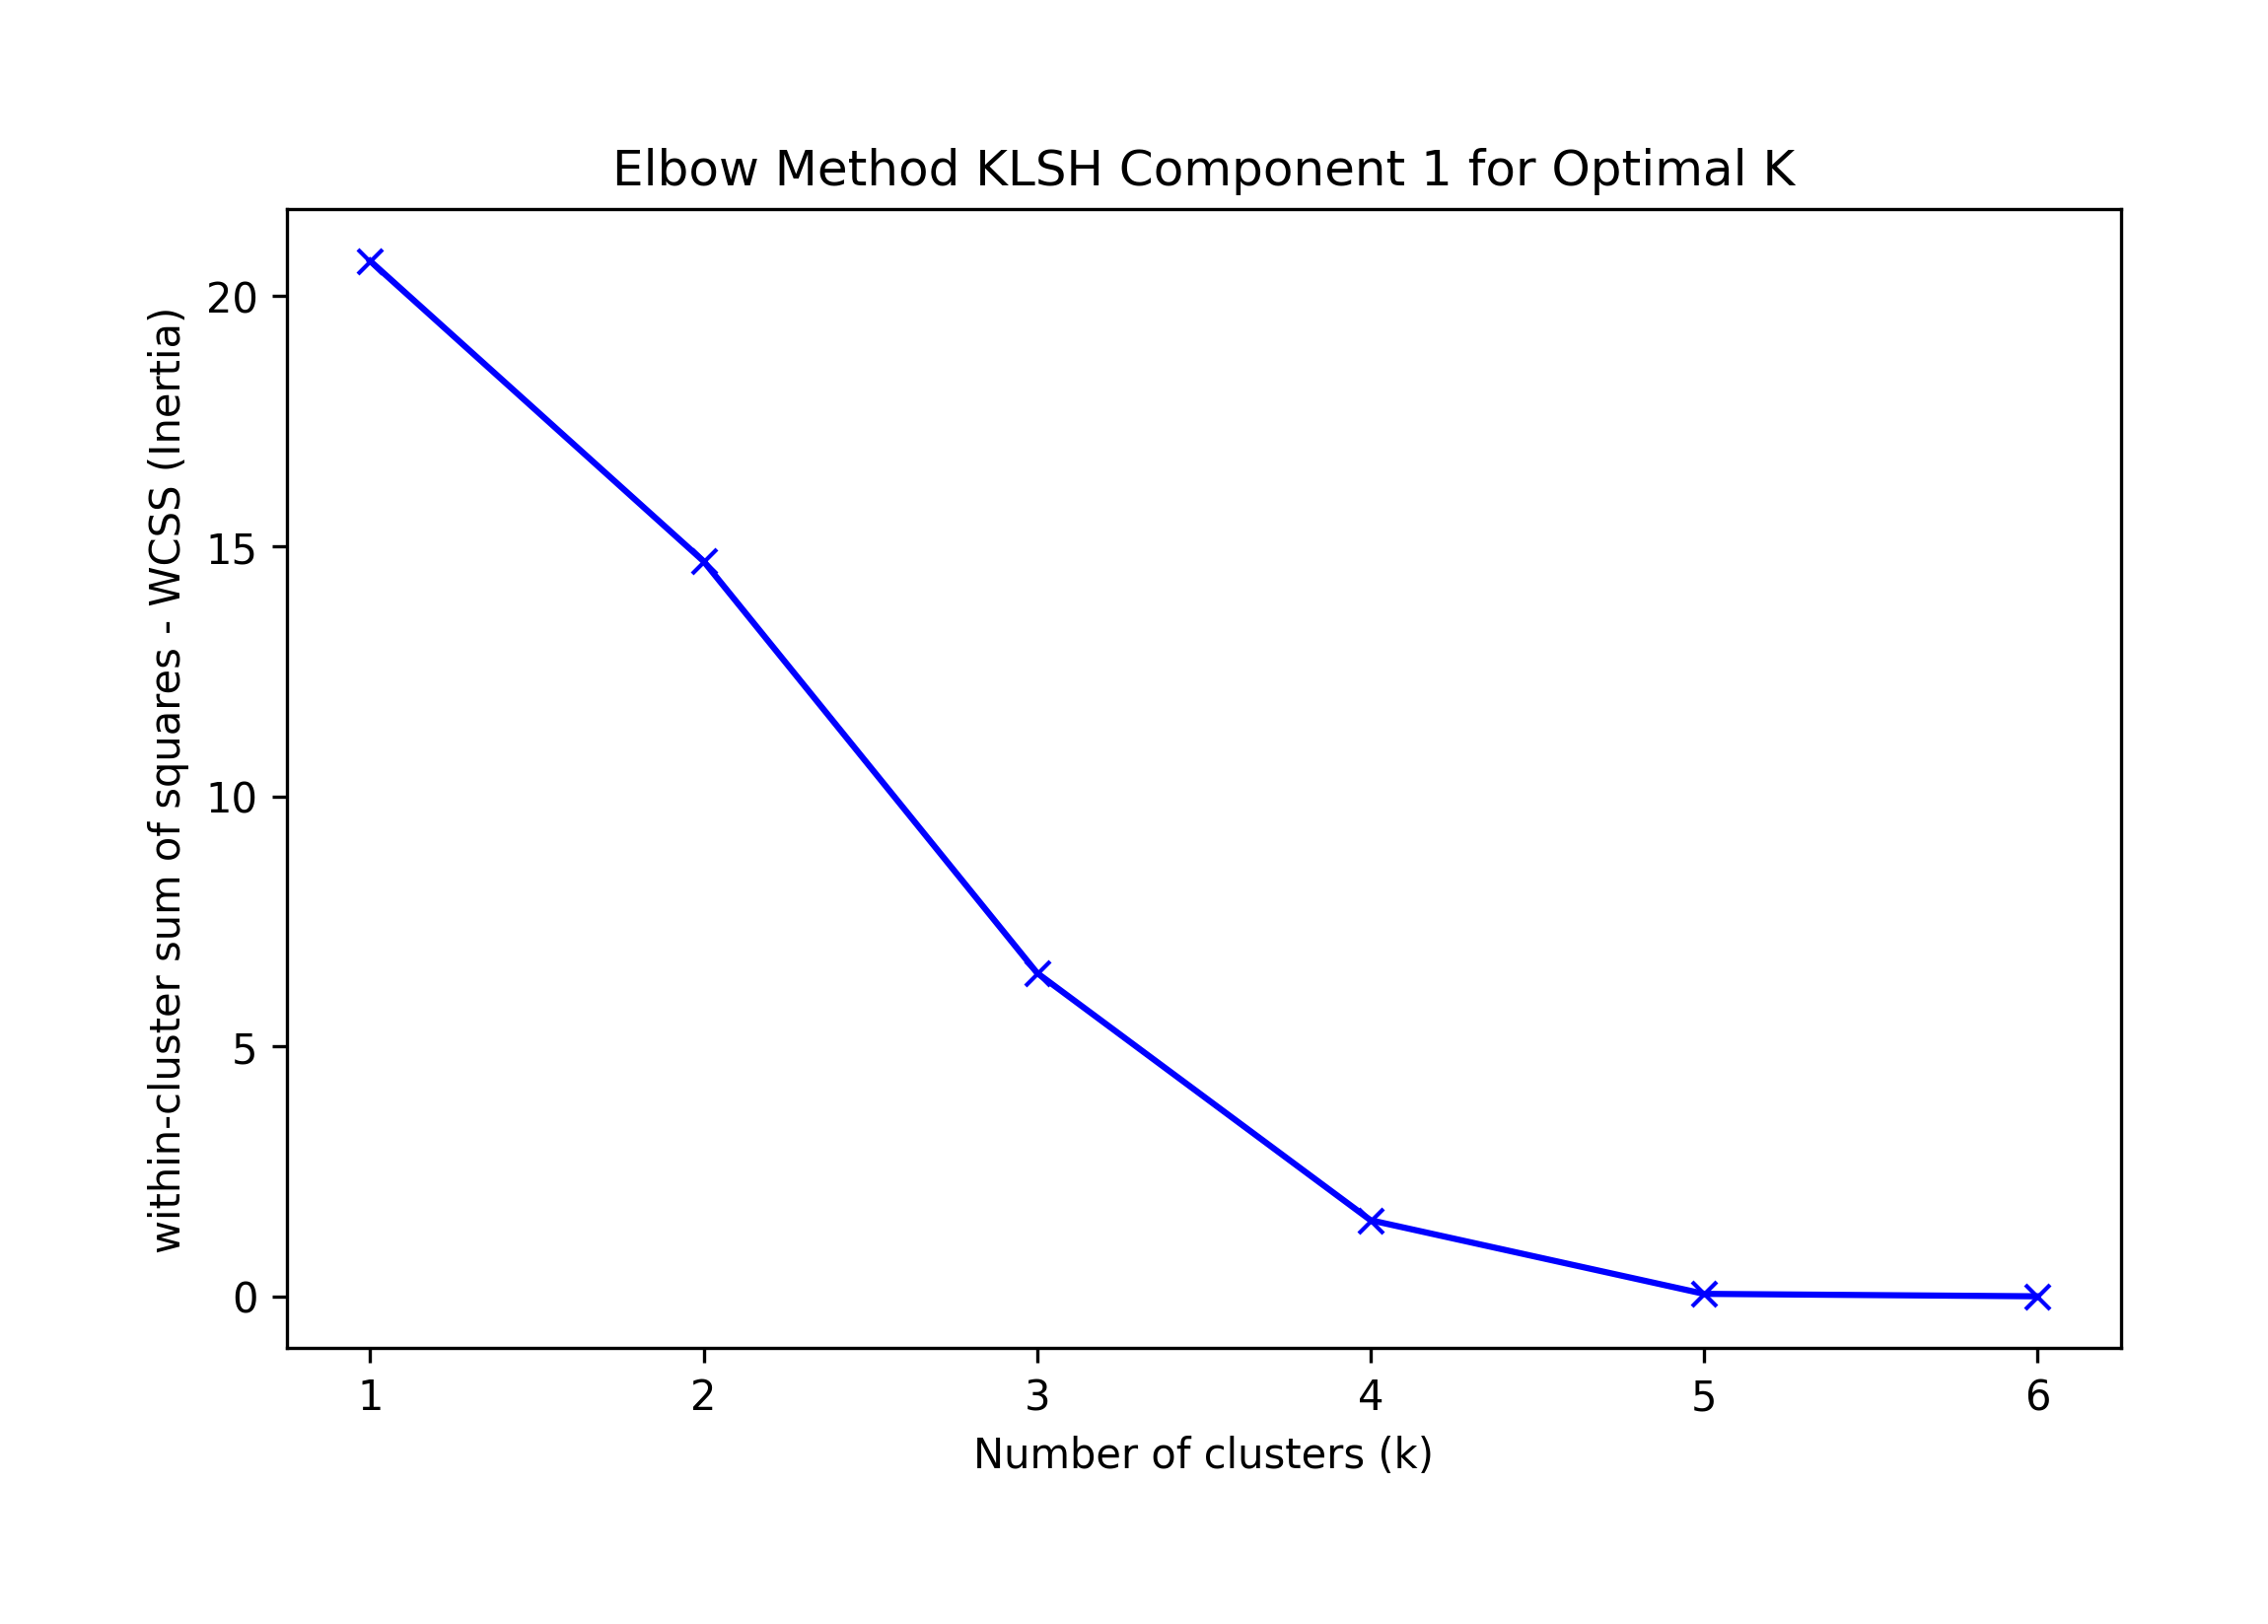
Sklearn's Silhouette method suggests K=4.
Best F-1 suggestion K=1.
We choose the highest F-1 at K=1 as a possible best solution, which incorrectly classifies record 14.
k=1: {0: [10, 11, 12, 13, 14, 15]}
Component 3:
== Final Clusters: ==
k=1:  {0: [16, 17, 18, 19, 20]}
k=2:  {0: [17], 1: [16, 18, 19, 20]}
k=3:  {0: [17], 1: [20], 2: [16, 18, 19]}
k=4:  {0: [17], 1: [20], 2: [16, 18], 3: [19]}
k=5:  {0: [17], 1: [20], 2: [16], 3: [19], 4: [18]}
Singletons: []
| K | F1 | Precision | Recall |
|---|---|---|---|
| 1 | 1.000000 | 1.000000 | 1.0000 |
| 2 | 0.750000 | 1.000000 | 0.6000 |
| 3 | 0.461538 | 1.000000 | 0.3000 |
| 4 | 0.181818 | 1.000000 | 0.1000 |
| 5 | 0.000000 | 0.000000 | 0.0000 |
Elbow K suggested by KneeLocator K=1 or 4; visually k=4.
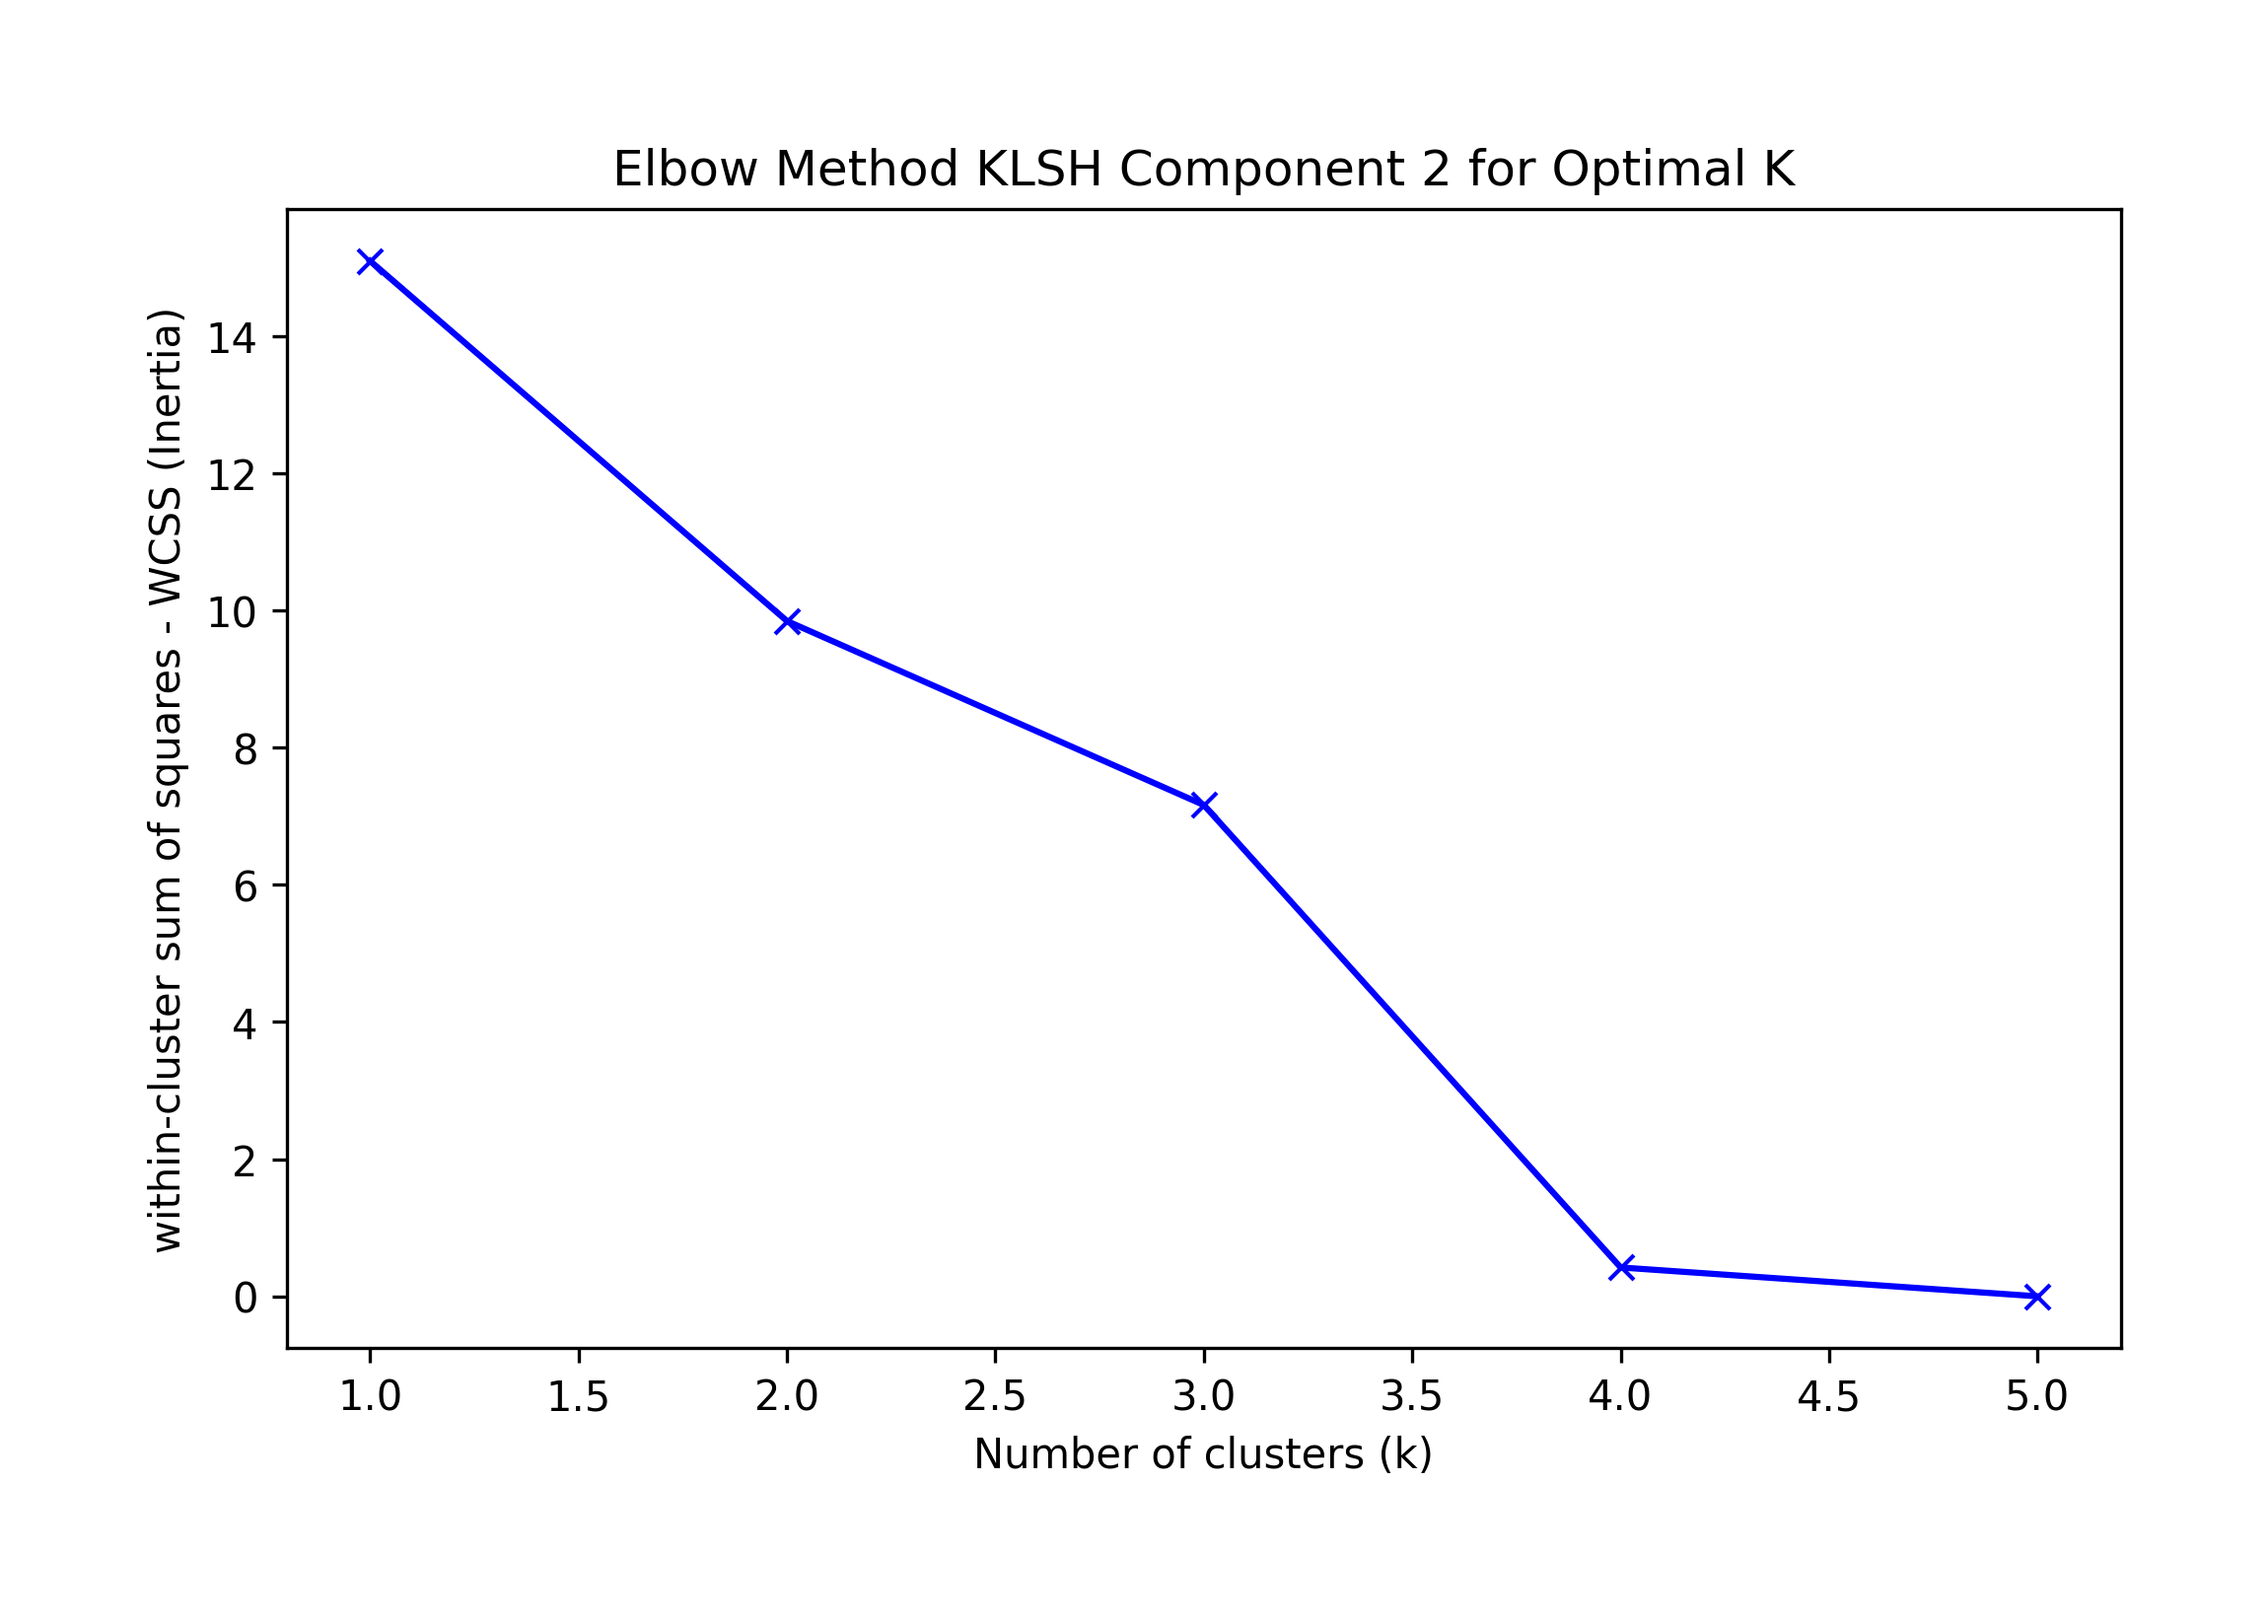
Sklearn's Silhouette method suggests K=4.
Best F-1 suggestion K=1.
We choose the highest F-1 at K=1 as a possible best solution, which correctly classifies all records.
We conclude
We will now seek to improve classification.
So far we have applied a uniform weight to all numeric features. Next, we explore custom weights for each feature using supervised Bayesian Optimization across all K over 100 calls, with objective function targeting the average of all components' results F1=1.
Further research is warranted to explore the design of an objective function targeting desired outcome such as F1=Precision=Recall=1 and biasing the optimization towards the preferred domain requirements.
In the scenario we have run, Bayesian plateaus and provides multiple - 56 - best weights for the highest best results. Thus we average these.
We also note that a weight observed multiple times at zero can be a hint that a particular feature is not adding much to model training and perhaps can be dropped. In such case and in this project, we do not remove a feature.
The best Baysian optimization results have the following feature weights and metrics:
Average F1 0.9523
Average Precision 1
Average Recall 0.9166
Average Bayesian Feature Weights = [0.32922948, 0.36130566, 0.20008195, 0.82066852, 0.44855293, 0.62657605, 0.36378109, 0.4405338, 0.2413675]
We re-run KLSH with these weights and for each Component we select the cluster results for the earliest highest F-1 in the dataframe. Therefore, we judge the success of the clustering algorithm result based on F-1 which does not require the implementation of an automated elbow method result interpretation and decision process.
Component 0: Incorrect at K=4
Best silhouette K = 2; Elbow Knee K = 1 or 3, Visual Elbow k=3 or 4; F1=4
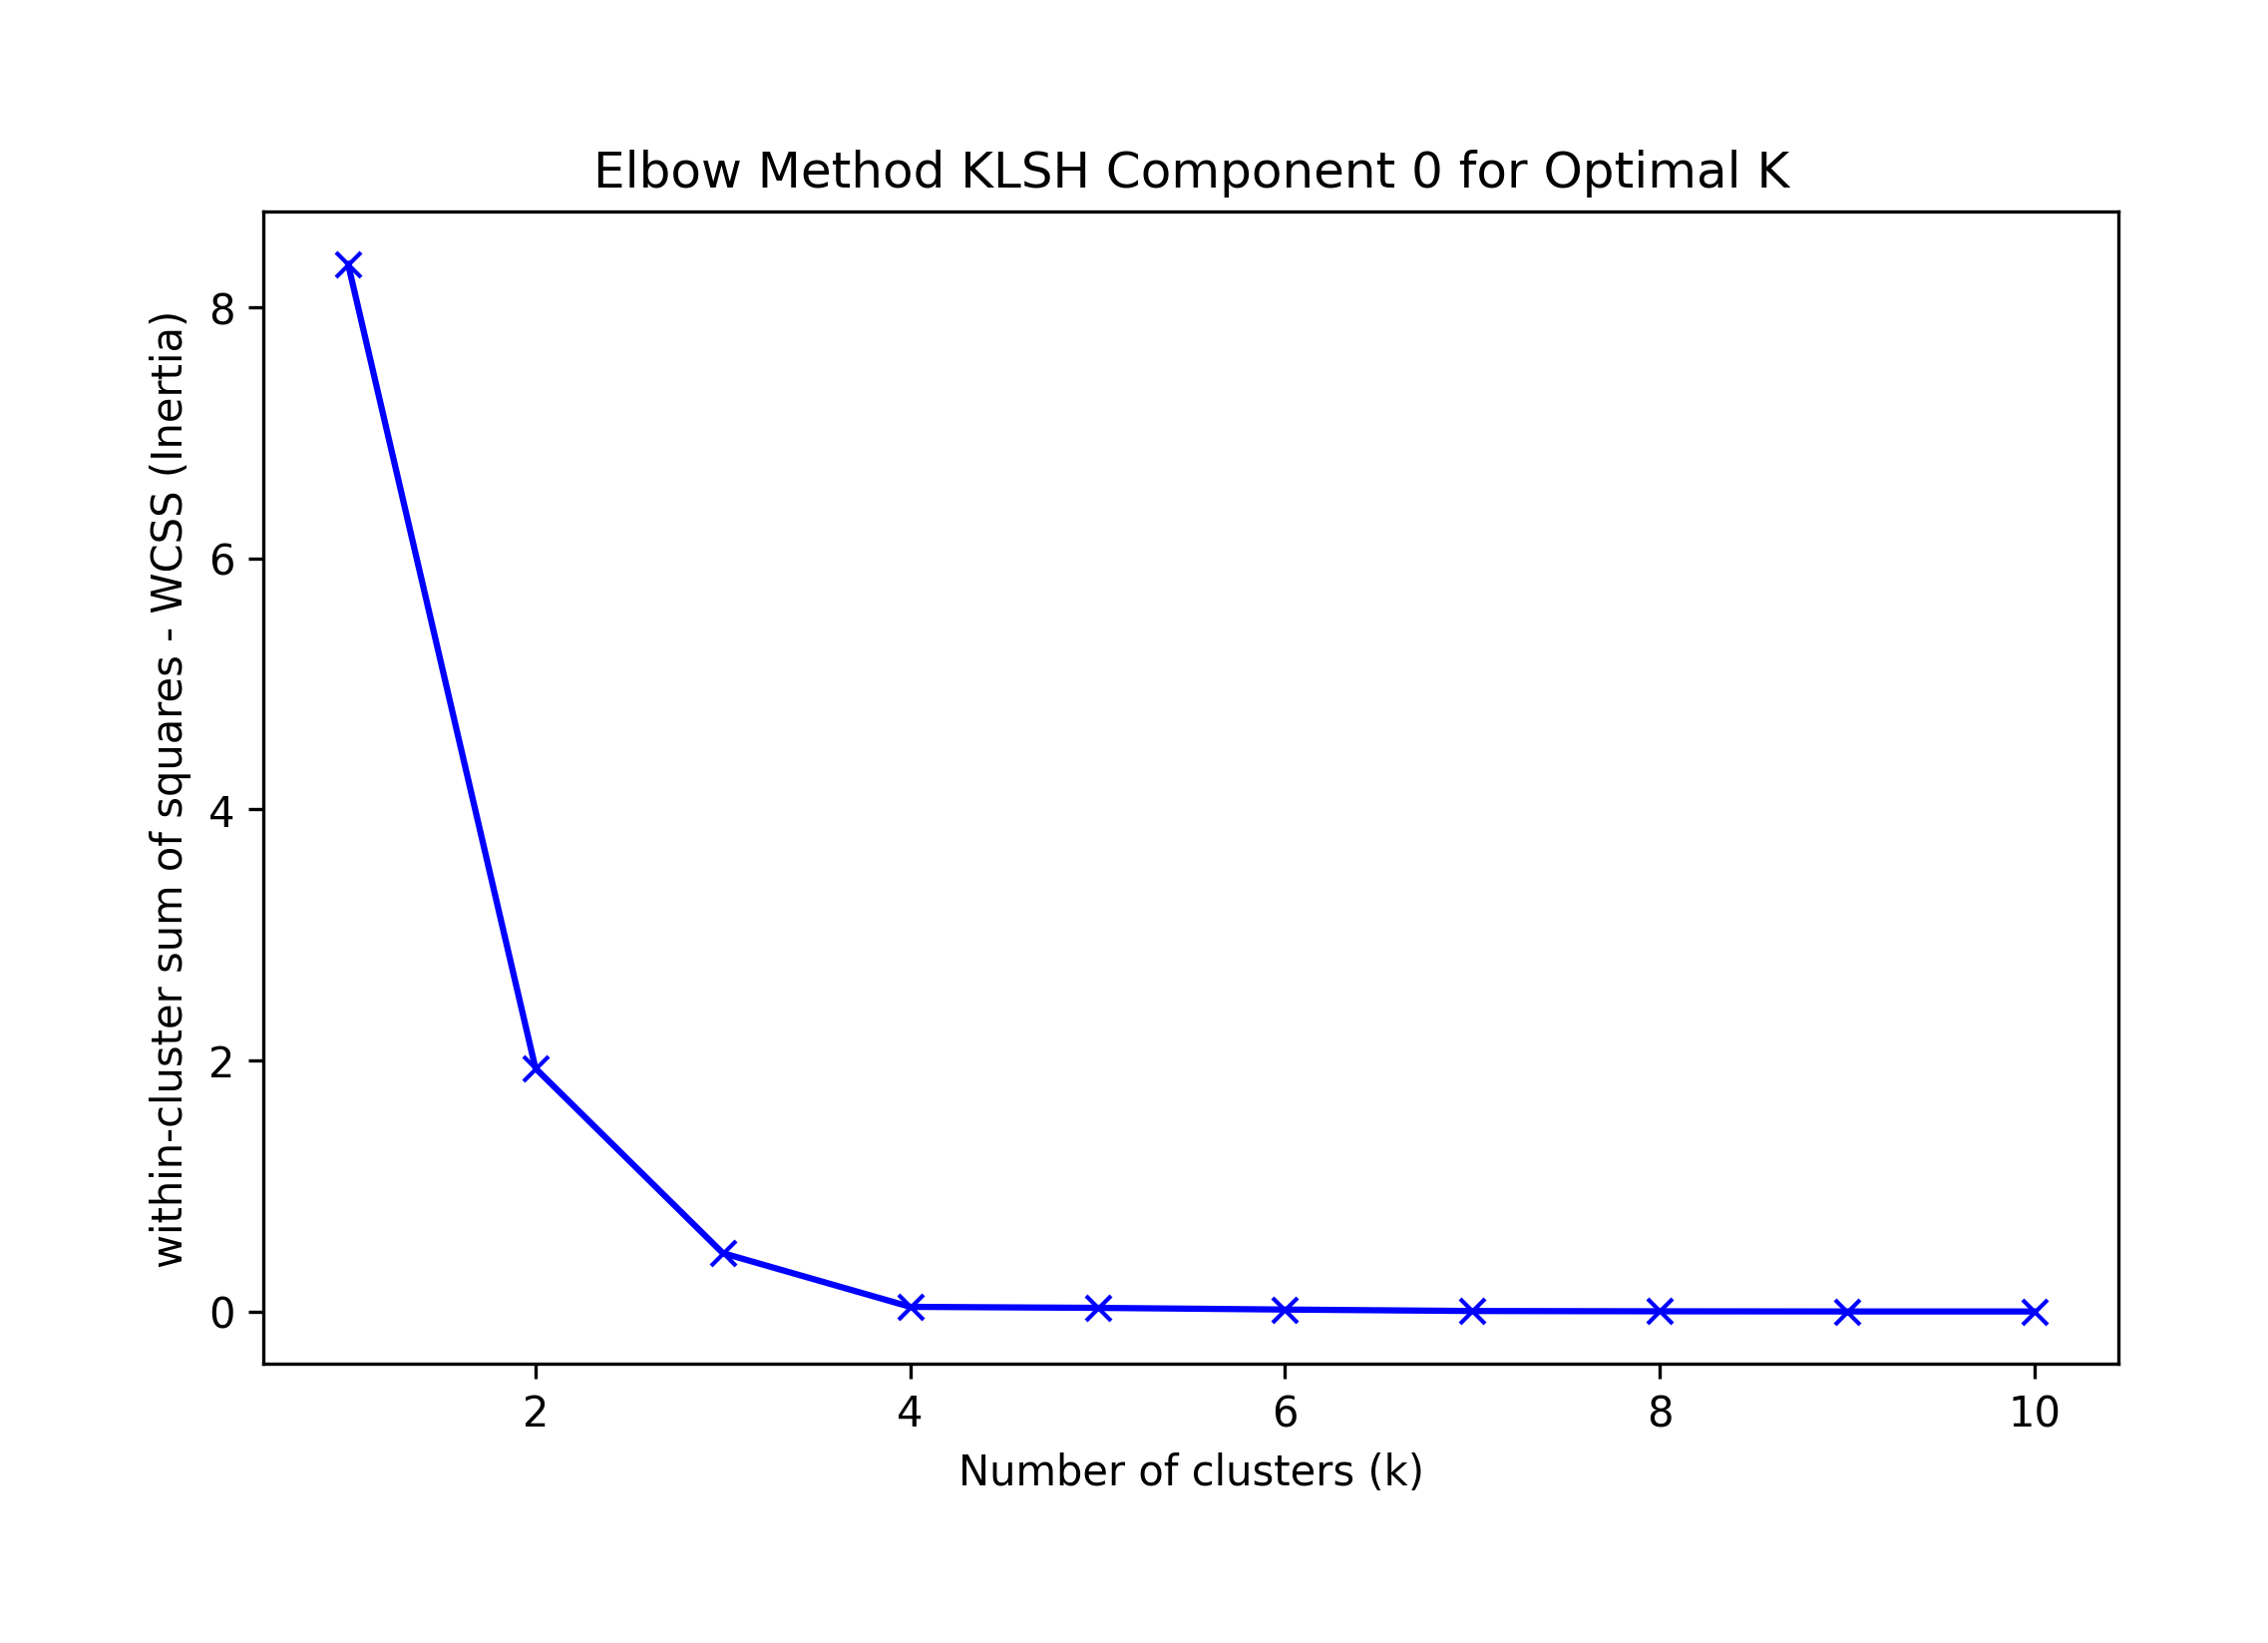
== Final Clusters: ==
k=1:  {0: [0, 1, 2, 3, 4, 5, 6, 7, 8, 9]}
k=2:  {0: [3], 1: [0, 1, 2, 4, 5, 6, 7, 8, 9]}
k=3:  {0: [3], 1: [5, 6, 7, 8, 9], 2: [0, 1, 2, 4]}
k=4:  {0: [3], 1: [6, 7, 8, 9], 2: [0, 1, 2, 4], 3: [5]}
k=5:  {0: [3], 1: [7], 2: [0, 1, 2, 4], 3: [5], 4: [6, 8, 9]}
k=6:  {0: [3], 1: [7], 2: [0, 2], 3: [5], 4: [6, 8, 9], 5: [1, 4]}
k=7:  {0: [3], 1: [7], 2: [0, 2], 3: [5], 4: [6, 8, 9], 5: [1], 6: [4]}
k=8:  {0: [3], 1: [7], 2: [0, 2], 3: [5], 4: [4], 5: [6, 9], 6: [1], 7: [8]}
k=9:  {0: [3], 1: [7], 2: [2], 3: [5], 4: [4], 5: [6, 9], 6: [1], 7: [8], 8: [0]}
k=10:  {0: [3], 1: [7], 2: [2], 3: [5], 4: [4], 5: [6], 6: [1], 7: [8], 8: [0], 9: [9]}
| K | F1 | Precision | Recall |
|---|---|---|---|
| 1 | 0.524590 | 0.355556 | 1.0000 |
| 2 | 0.461538 | 0.333333 | 0.7500 |
| 3 | 0.750000 | 0.750000 | 0.7500 |
| 4 | 0.857143 | 1.000000 | 0.7500 |
| 5 | 0.720000 | 1.000000 | 0.5625 |
| 6 | 0.476190 | 1.000000 | 0.3125 |
| 7 | 0.400000 | 1.000000 | 0.2500 |
| 8 | 0.222222 | 1.000000 | 0.1250 |
| 9 | 0.117647 | 1.000000 | 0.0625 |
| 10 | 0.000000 | 0.000000 | 0.0000 |
Component 1: Correct at K=2
Best silhouette K = 2; Elbow Knee K = 1 or 2, Visual Elbow k=2; F1=2
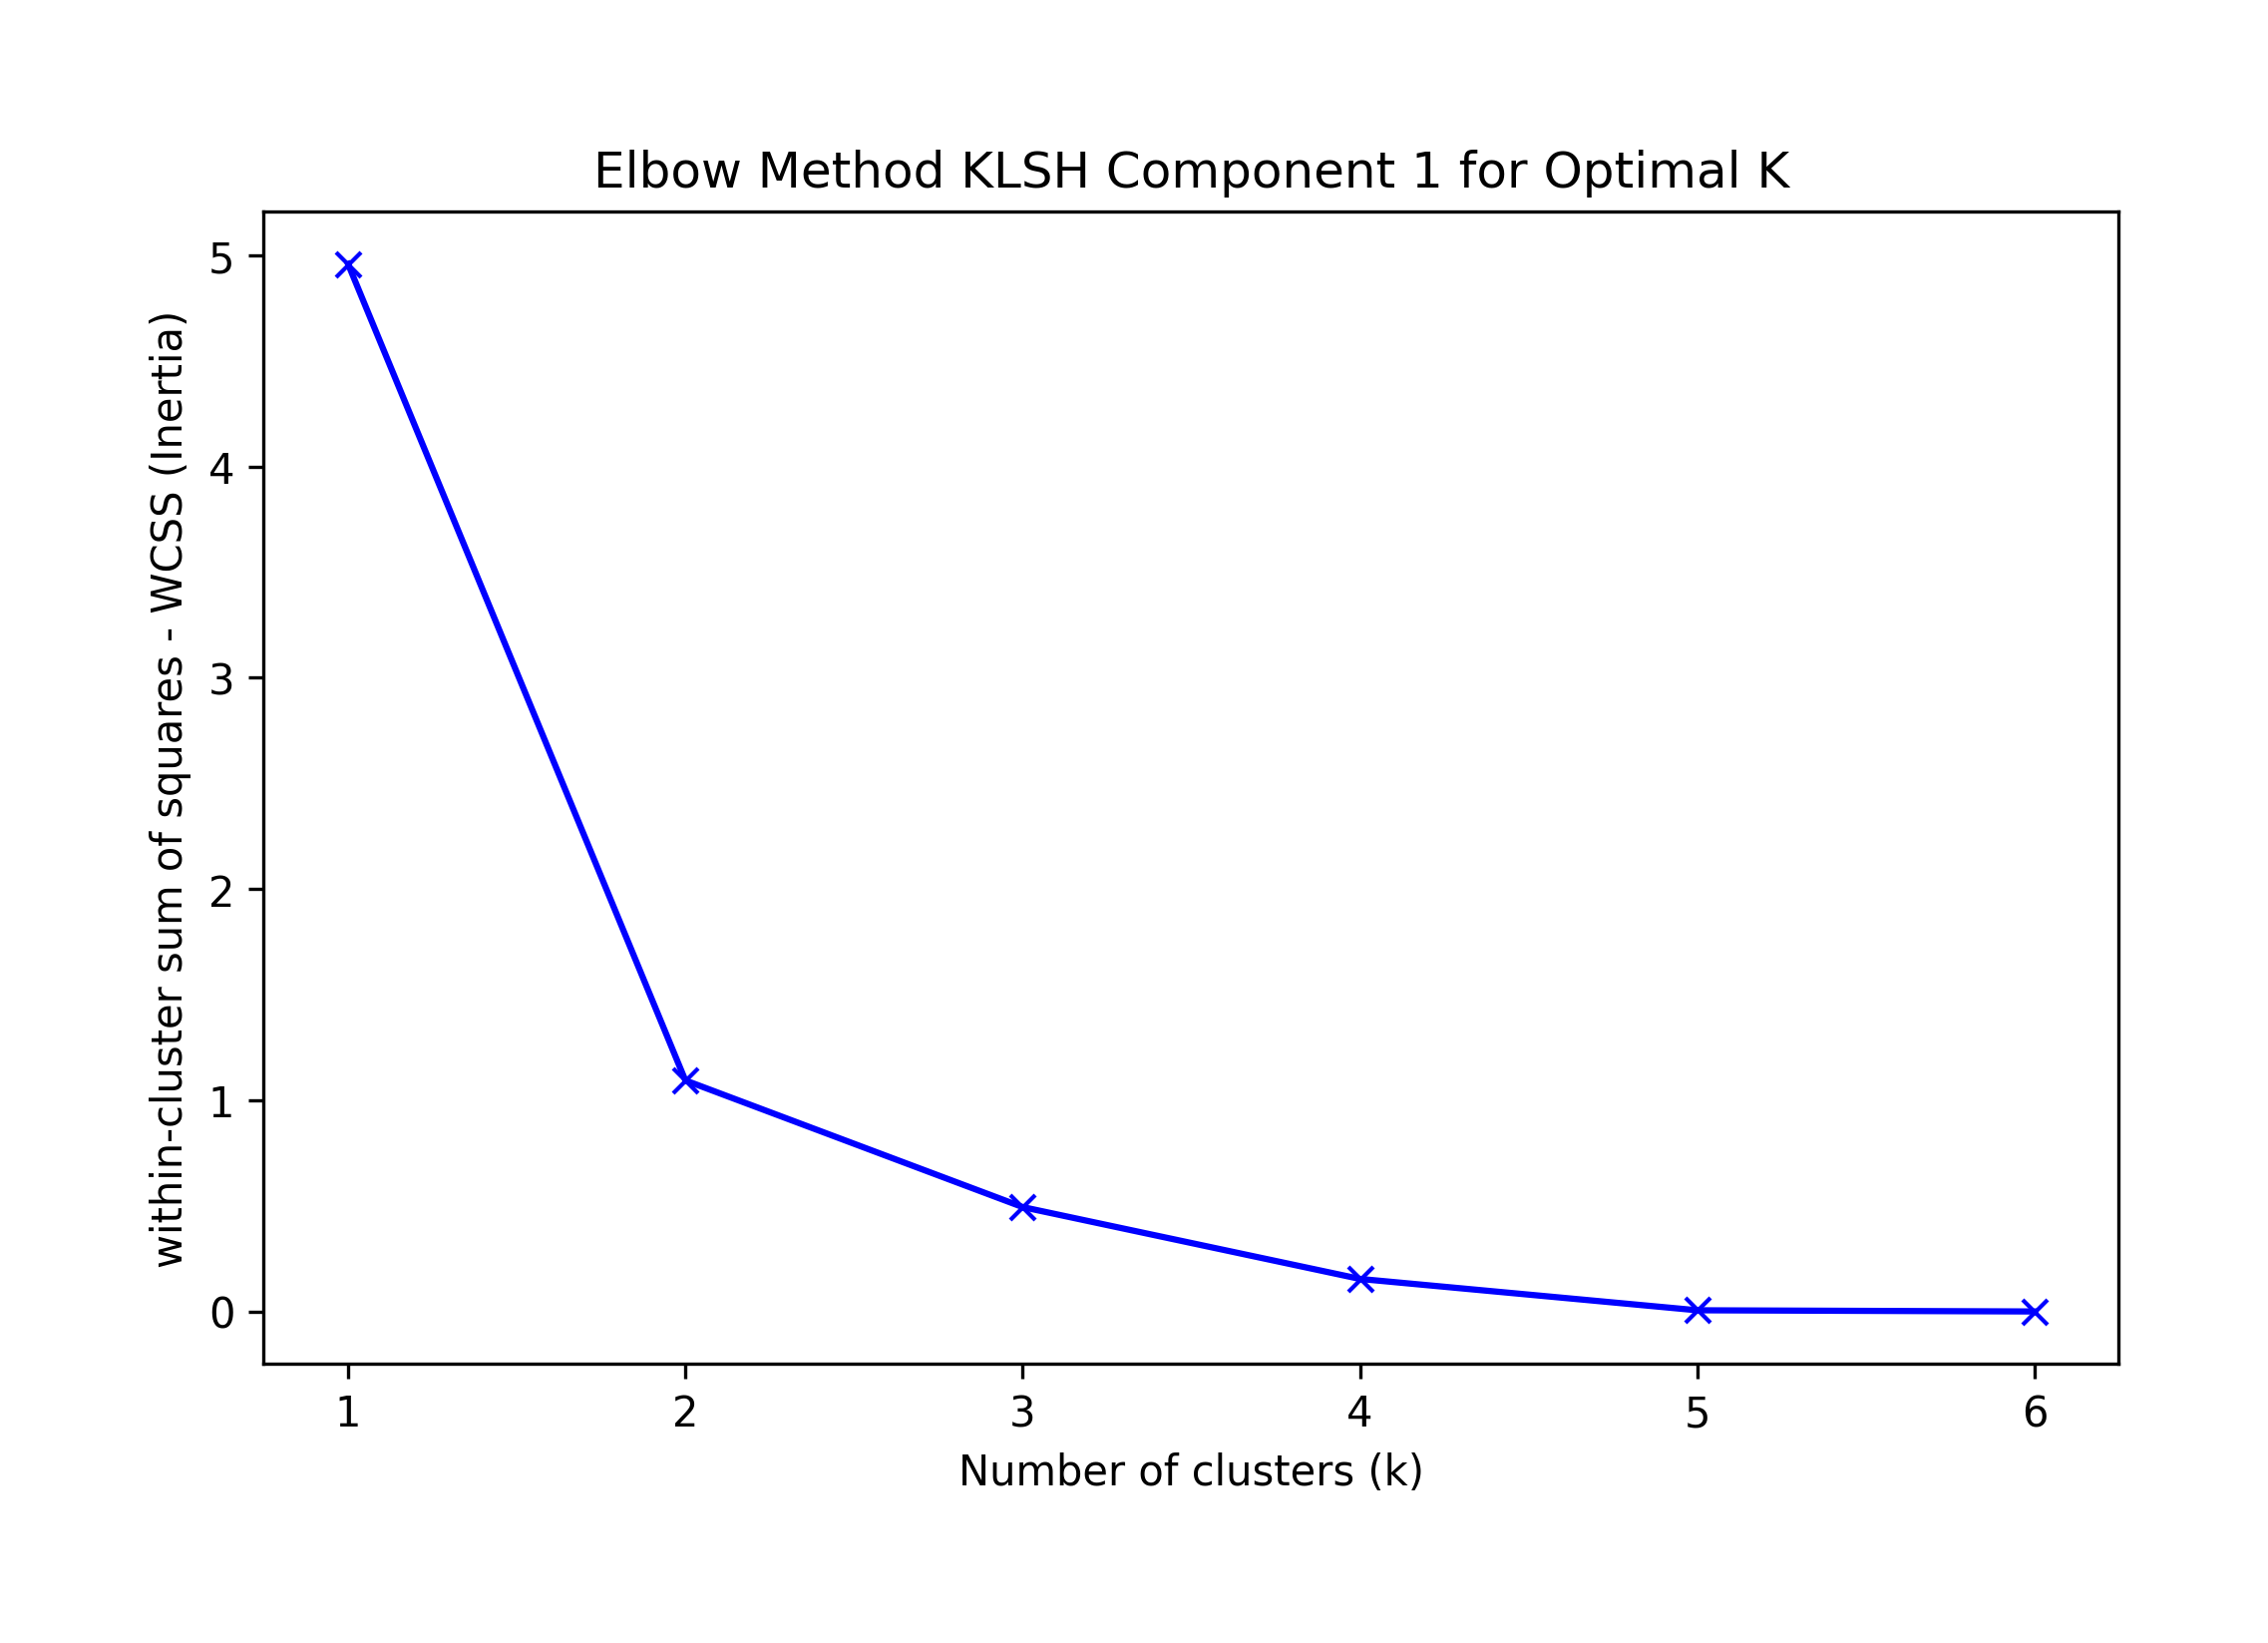
== Final Clusters: ==
k=1:  {0: [10, 11, 12, 13, 14, 15]}
k=2:  {0: [10, 11, 12, 13, 15], 1: [14]}
k=3:  {0: [11, 12], 1: [14], 2: [10, 13, 15]}
k=4:  {0: [11, 12], 1: [14], 2: [10, 13], 3: [15]}
k=5:  {0: [12], 1: [14], 2: [10, 13], 3: [15], 4: [11]}
k=6:  {0: [12], 1: [14], 2: [10], 3: [15], 4: [11], 5: [13]}
| K | F1 | Precision | Recall |
|---|---|---|---|
| 1 | 0.800000 | 0.666667 | 1.0 |
| 2 | 1.000000 | 1.000000 | 1.0 |
| 3 | 0.571429 | 1.000000 | 0.4 |
| 4 | 0.333333 | 1.000000 | 0.2 |
| 5 | 0.181818 | 1.000000 | 0.1 |
| 6 | 0.000000 | 0.000000 | 0.0 |
Component 2: Correct at K=1
Best silhouette K = 2; Elbow Knee K = 1 or 2, Visual Elbow k=2; F1=1
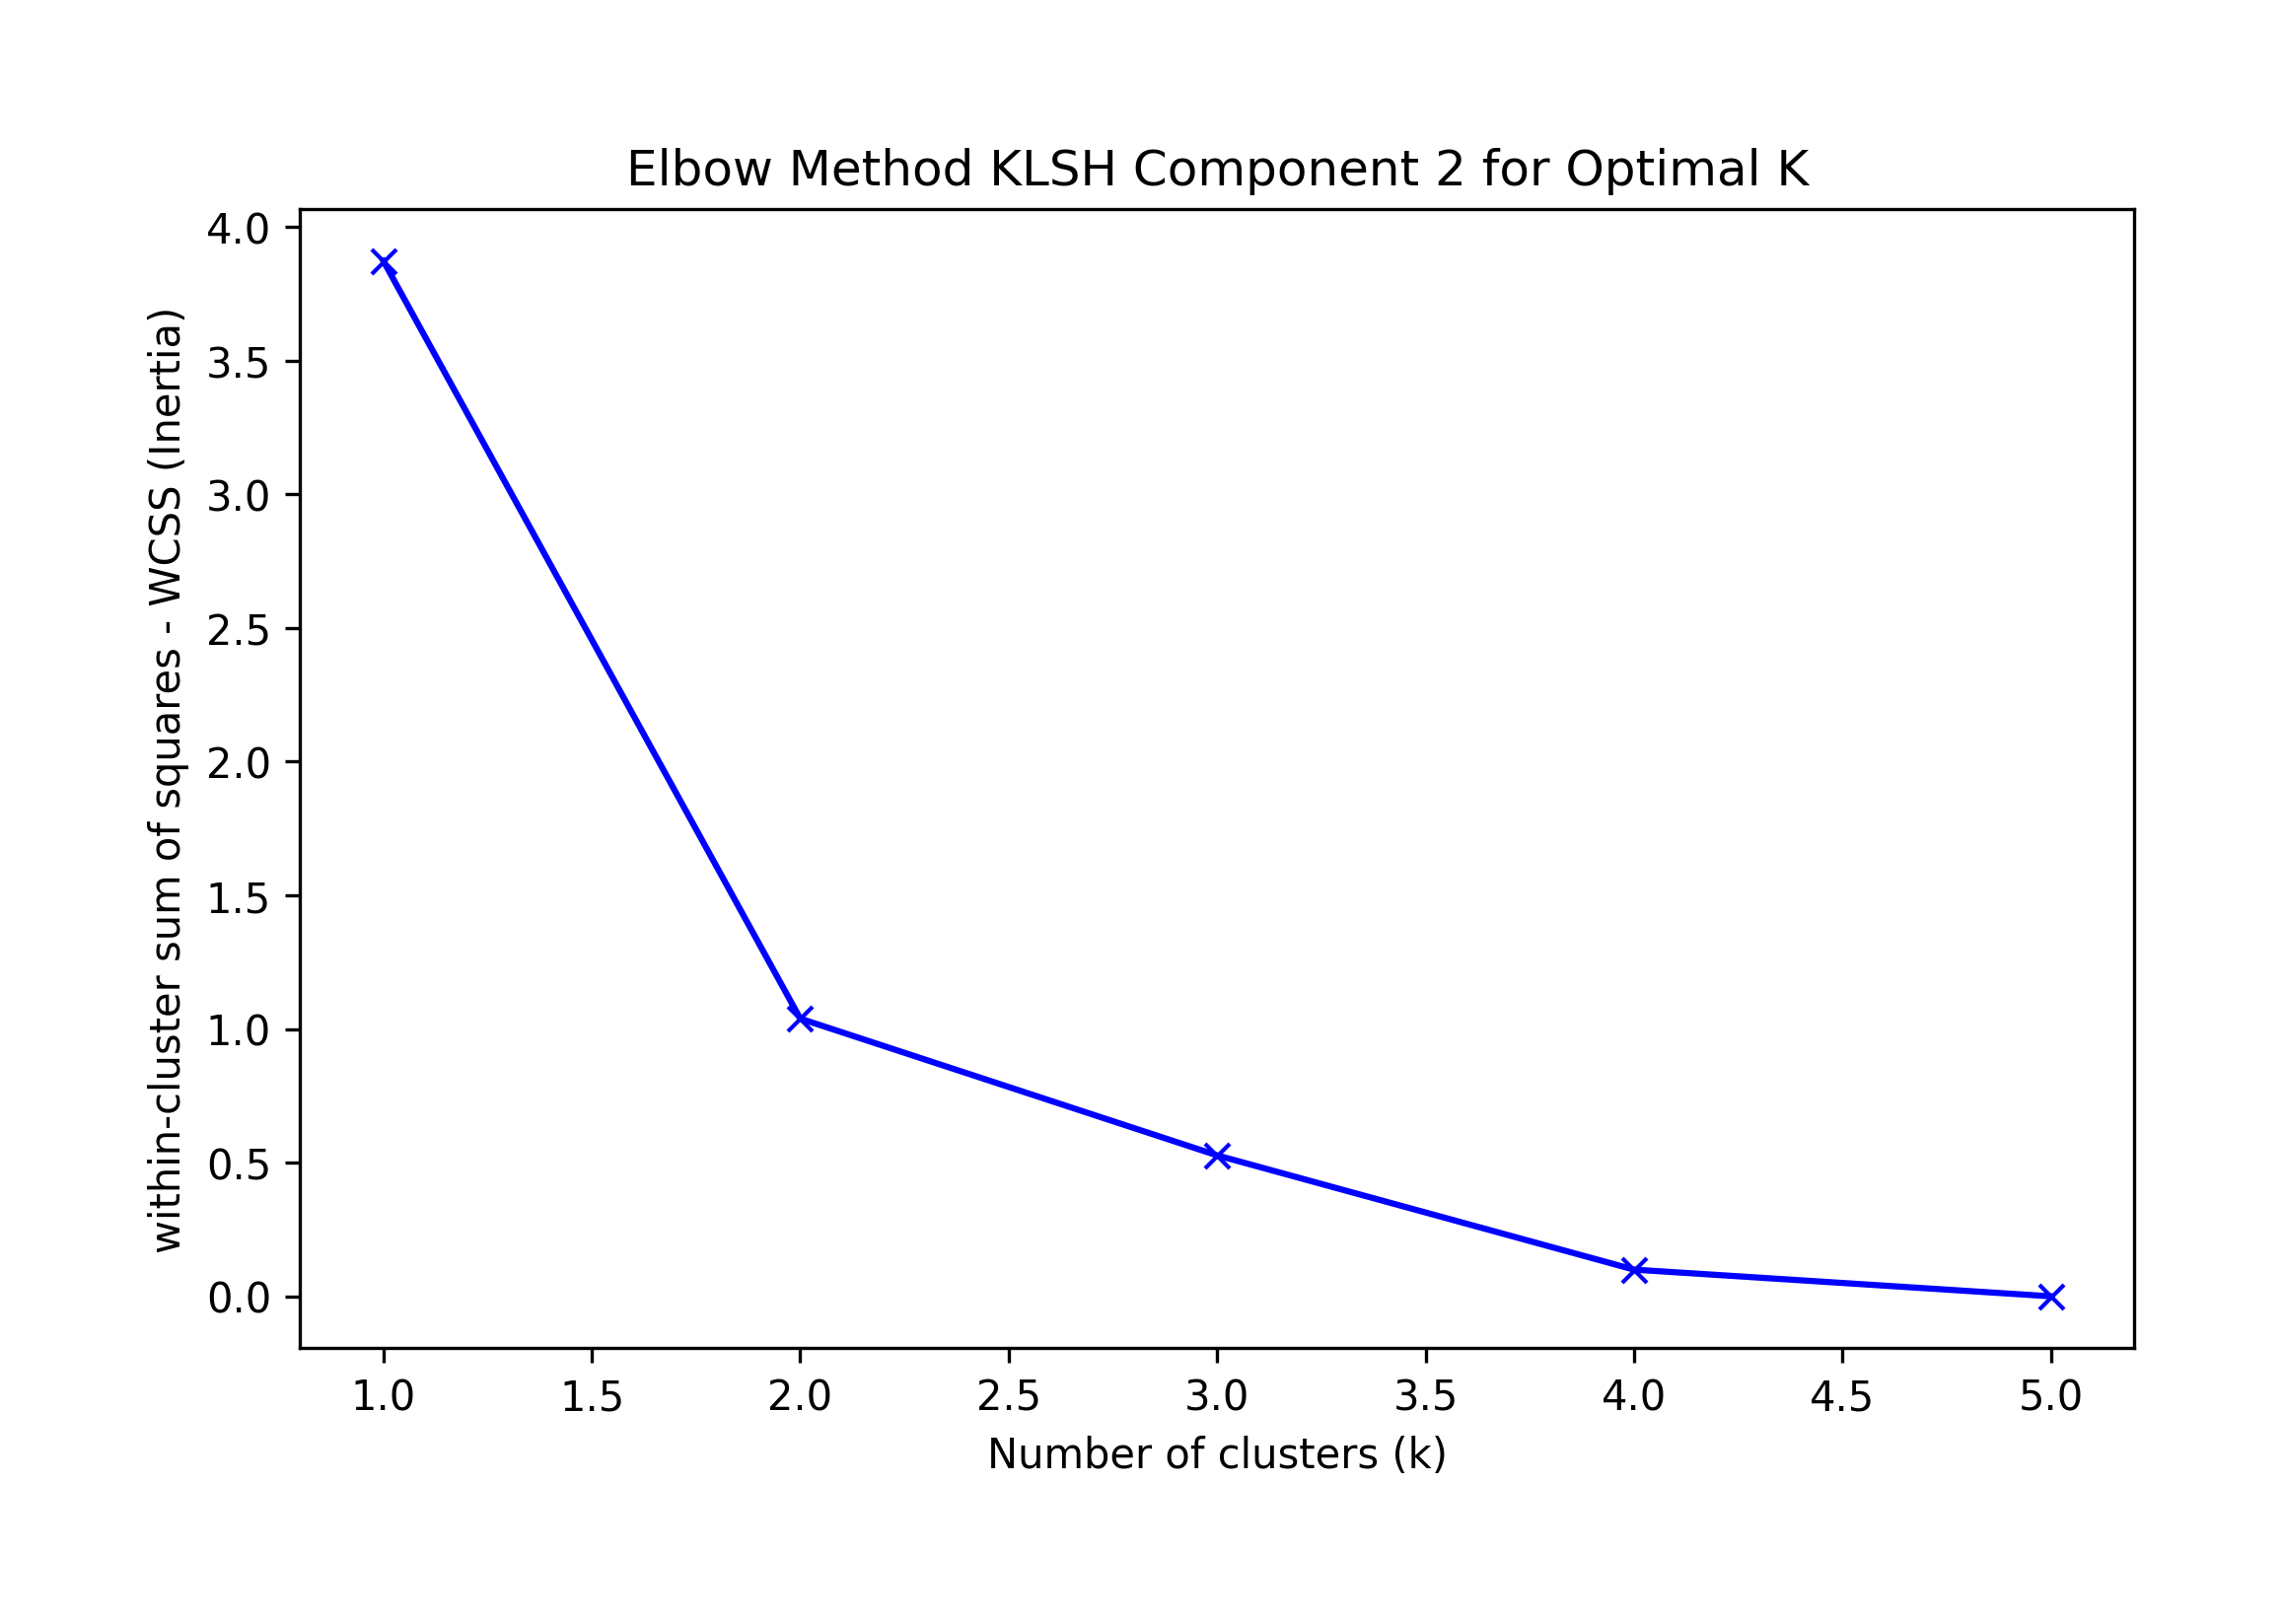
== Final Clusters: ==
k=1:  {0: [16, 17, 18, 19, 20]}
k=2:  {0: [17], 1: [16, 18, 19, 20]}
k=3:  {0: [17], 1: [16, 19, 20], 2: [18]}
k=4:  {0: [17], 1: [16, 20], 2: [18], 3: [19]}
k=5:  {0: [17], 1: [20], 2: [18], 3: [19], 4: [16]}
| K | F1 | Precision | Recall |
|---|---|---|---|
| 1 | 1.000000 | 1.0 | 1.0 |
| 2 | 0.750000 | 1.0 | 0.6 |
| 3 | 0.461538 | 1.0 | 0.3 |
| 4 | 0.181818 | 1.0 | 0.1 |
| 5 | 0.000000 | 0.0 | 0.0 |
We conclude:
Further research may benefit this analysis by normalizing the transformed features as input to the KMeans algorithm and thereby remove the influence of magnitude. A more manually laborous but perhaps insightful approach may be by filtering out input records to the KMeans algorithm based on cosine similarity to focus on the angle between vectors and remove the influence of magnitude, unlike the KMeans ecludian distance.
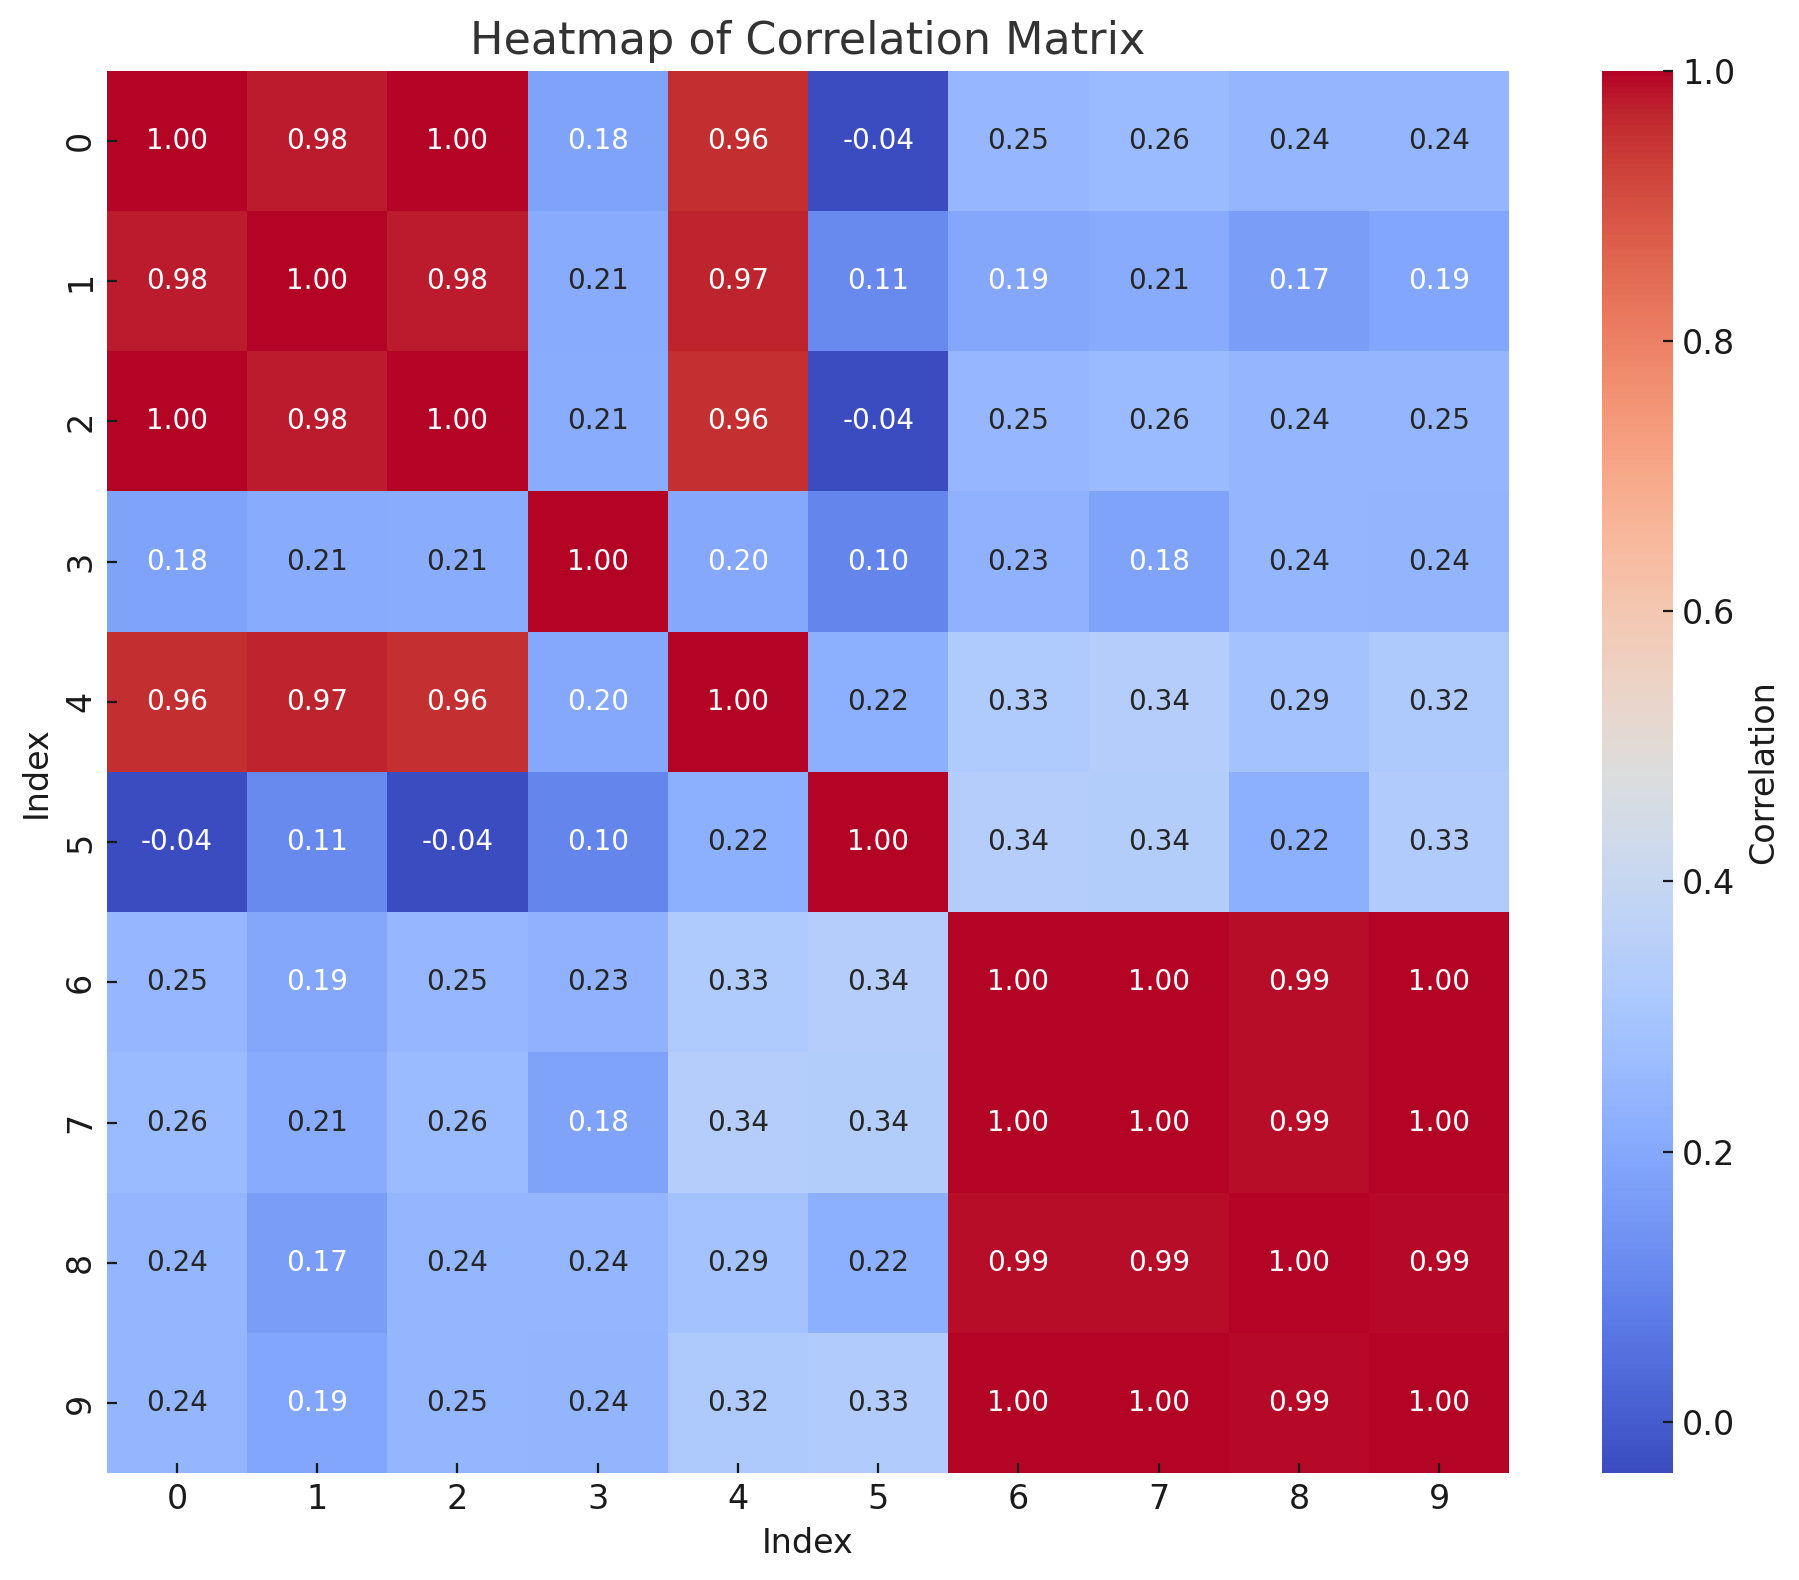
As shown on the heat map below which shows the cosine similarity for records in component 0, we may have been too extreme adding typos to the dataset features for record 3 and it may deserve to be an entity by itself and indeed unrelated to records 0,1,2,4.
We conclude that post feature weight optimization, the training set exhibits the following performance metrics:
| Component | F1 | Precision | Recall |
|---|---|---|---|
| 0 | 0.857143 | 1.000000 | 0.750000 |
| 1 | 1.000000 | 1.000000 | 1.000000 |
| 2 | 1.000000 | 1.000000 | 1.000000 |
| Average | 0.952381 | 1.000000 | 0.916667 |
Generalization of these results with a larger training dataset and an evaluation dataset may surface considerations not addressed and yield better results.
The resulting F-1/Precision/Recall=0.952/1.00/0.916 is a good start and domain input on blocking rules, feature engineering experimentation and transformations can greatly increase these results.
A blocking graph approach helps us scale this solution for larger datasets by reducing all record comparisons which is an O(n
The blocking rules approach can be easily expanded and capture nuances specific to the domain with a deeper graph.
The pre-processing techniques applied to a dataset, distance measure and clustering algorithm can have a significant impact on the final clustering results. In this project, we found that optimizing feature weights helped us correctly classify the records in one of the two incorrectly classified components. In addition, further distance conditions in pair selection may also help capture outliers and new entities. This provides an interesting opportunity to create ensembles and diversify the way we capture nuances in the dataset.
Blocking rule refinement and the optimization of the order as to how these are applied can generate more accurate component composition results and help in finding singletons pre-KLSH clustering. Elbow and silhouette unsupervised k-determination is difficult. For instance, the K determined by the KneeLocator library requires the user to run the algorithm having previously established the type of curve (convex, concave) and its slope. An automated solution or computer vision solution can help us determine the value for these parameters but we find that the user's visual comparison of these metrics and F-1 helps reach a more robust k-determination.
We often find that a production pipeline requires the program to determine K without user intervention. There may be scope for further research to achieve this by training a classifier such as XGBoost, and using an X-training_dataset composed of the record features, Elbow KneeLocator K result, silhouette score K result, and a desired F-1/Precision/Recall target; the Y-training_dataset the ground truth K.
The resulting bayesian optimized weights gives us some insight into the average importance placed by the model across features, components and clusters. We observe resonance and longevity_sin drive a great deal of the result in this analysis whilst the tension feature does not. Domain knowledge may bias these results or justify its meaning.
| Feature | Weight |
|---|---|
| tension_adj_cos | 0.32922948 |
| tension_adj_sin | 0.36130566 |
| tension | 0.20008195 |
| resonance | 0.82066852 |
| longevity_cos | 0.44855293 |
| longevity_sin | 0.62657605 |
| quality_cos | 0.36378109 |
| quality_sin | 0.44053380 |
| amt_sold | 0.24136750 |
There may be scope for further research to further increase the interpretability of our results. On possible approach may entail training a supervised classifier e.g. random forest with x_training=record_norm_features and y=record_cluster. feature_importances_ can yield insight onto the drivers for our results since it give us the statistical accumulation of the impurity decrease within each tree.
Alternatively, the analysis of the distribution for each feature in each cluster may shed some light how these also affect clustering.
The list below outlines potential further research that was mentioned in this article and that we may enhance once the core methodologies have been completed.
Enhancement to Entity Resolution with KLSH publication:
Replacement of KLSH for Hierarchical clustering
Enhancement to Entity Resolution with KLSH publication:
Adding record name phonetic encoding and its vectorization or one hot encoding to KLSH feature inputs
Blocking hierarchical order optimization via bayesian optimization:
Instead of banking on a single blocking phonetic rule to block, we add additional blocking rules (e.g. numeric bins, etc) to generate a graph. We run bayesian optimization to select the hierarchical order of rules, alter rule values (e.g. number of bins, sampling such as np.linspace, np.logspace, etc).
Application of multiple similarity methods as an ensemble:
Application of different pre-processing methods to run similarity measures including cosine similarity and dot product to capture both angle and magnitude.
Normalization of the the transformed features as input to the KMeans algorithm and thereby remove the influence of magnitude, unlike the KMeans ecludian distance. A more laborous but perhaps insightful approach may be by filtering out input records for the KMeans algorithm based on cosine similarity to focus on the angle between vectors.
Unsupervised k-determination classifier:
Train a classifier such as XGBoost, and using X-training_dataset composed of the record features, Elbow KneeLocator K result, silhouette score K result, and a desired F-1/Precision/Recall target; the Y-training_dataset the ground truth K.
KLSH Interpretability - Supervised Learning:
Train a supervised classifier e.g. random forest with x_training=record_norm_features and y=record_cluster. feature_importances_ can yield insight onto the drivers for our results since it give us the statistical accumulation of the impurity decrease within each tree.
KLSH Interpretability:
A violin plot can shed light on the distribution for each feature in each cluster and thus the importance each feature plays on the final clustering classification.
This is a preprint version. Cite as: Solorzano Gimenez, S. (2025). Entity Resolution: Meta-Blocking and KLSH. [Preprint]. ReadyTensor. The content has not undergone peer review and is subject to change. DOI: 10.5281/zenodo.15685013
Dataset DOI: 10.5281/zenodo.15704974
Keywords: entity resolution, deduplication, linkage, blocking, meta-blocking, machine learning, clustering, tabular data