This project introduces an AI-powered system that automates the entire data analysis and report generation process. It transforms raw data into clear, professional reports, complete with visualizations and key insights. Our system leverages a multi-agent architecture orchestrated by LangGraph, integrating robust tools like Pandas, Matplotlib, Seaborn, and WeasyPrint. This automation significantly reduces manual effort and time, allowing users to quickly derive actionable value from their data and focus on strategic decision-making.
Live Application
You can view and interact with the deployed AI Data Analyst & Report Generator live on Streamlit Cloud here: https://ai-report-generator-2-0.streamlit.app
In today's rapidly evolving business landscape, data is an invaluable asset. However, the journey from raw data to actionable insights is often complex, time-consuming, and resource-intensive. Traditional data analysis involves manual steps for data preparation, iterative visualization, and the laborious process of drafting comprehensive reports. This project directly addresses these bottlenecks by presenting an innovative AI-powered solution that fully automates this workflow. Our system is designed to democratize sophisticated data analysis, enabling users across various domains to generate consistent, high-quality, and professional reports efficiently, without requiring deep technical expertise.
This project is a continuation of the concepts explored in AI Data Analyst & Report Generator , which laid the groundwork for multi-agent systems in AI. This advanced iteration focuses on building a safe, testable, and robust application from that initial prototype.
The system is built on a multi-agentic architecture, where specialized AI agents collaborate to perform a series of tasks. This advanced approach enables a more robust, dynamic, and reliable workflow than a single-agent system.
Data Ingestion & Validation Agent: Responsible for securely receiving the user's data (e.g., CSV files) and performing an initial validation to ensure the data is suitable for analysis. This agent also handles data cleaning tasks.
Data Analysis Agent: This agent is the analytical core of the system. It uses libraries like Pandas to analyze the data, identify key trends, and generate insights.
Visualization Agent: Translates the analyzed data and insights into visual representations. It automatically creates relevant charts and graphs (e.g., line charts, bar graphs) to make the data more understandable.
Safety Node: This critical component acts as a final safeguard in the report generation process. After the Report Generation Agent drafts the report, it is passed to the Safety Node for an automated review. This agent's primary function is to check for potential issues such as factual inconsistencies, generated hallucinations, or the inclusion of sensitive or unsafe content. If the report fails this check and there are retries remaining, the Safety Node sends it back to the Report Generation Agent with feedback for revision. This ensures that only high-quality, safe, and accurate reports are finalized.
Report Generation Agent: The final step in the workflow. This agent takes all the insights, visualizations, and summary text and composes a professional, comprehensive, and well-structured report. It utilizes WeasyPrint to convert the final HTML content into a downloadable PDF.
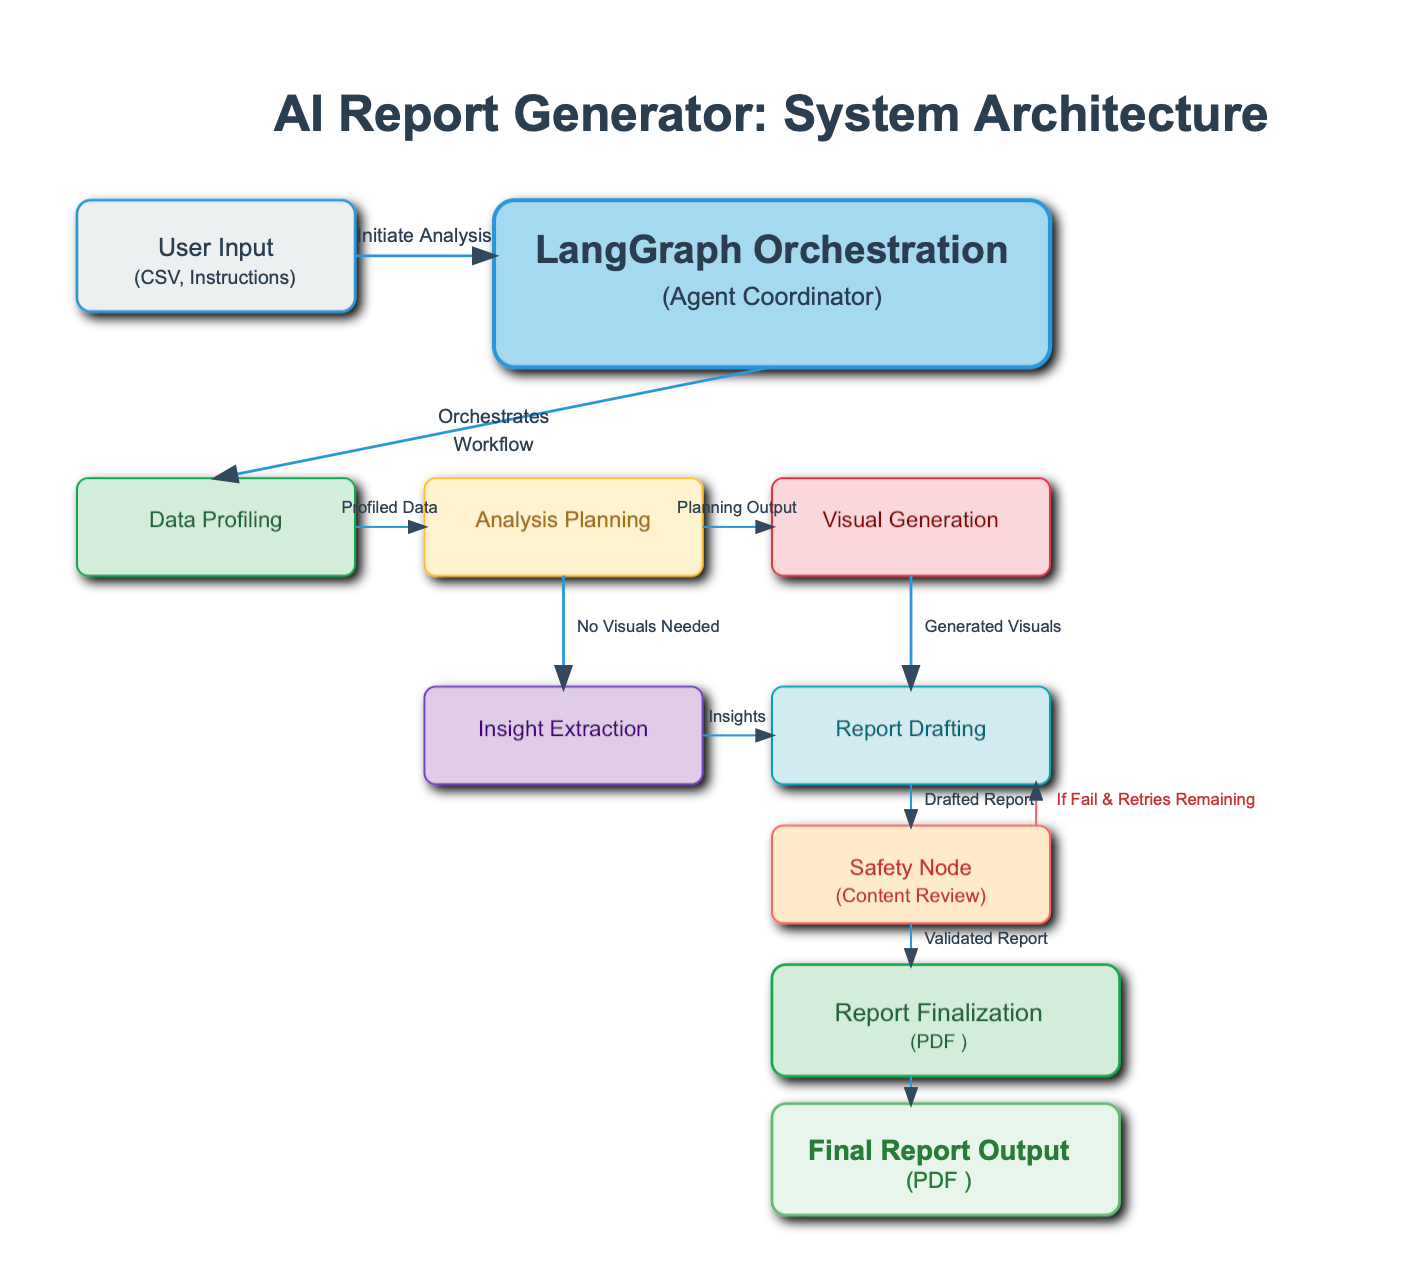
The following diagram illustrates the flow of data and the interaction between the different agents within the system:
graph TD
    A[User Uploads CSV] --> B(Data Ingestion Agent);
    B --> C{Data Validation & Cleaning};
    C -->|Invalid Data & Instructions| I(Notify User of Errors);
    C -->|Valid Data & Instructions| D(Data Analysis Agent);
    D --> E(Visualization Agent);
    E --> F(Report Drafting Agent);
    F --> G(Safety and Accuracy Check);
    G --> |If Pass| H[Downloadable PDF Report];
    G --> |If Fail & Retries Remaining| F;
    G --> |If Fail & No Retries| J(Notify User of Errors);
    I --> A;
    J --> A;
langchain-google-genai)To ensure the system is safe, reliable, and production-ready, it has been built with the following key features:
To guarantee the system's reliability and production readiness, a rigorous testing suite was developed using pytest. The tests are structured in a hierarchical manner, ensuring functionality is verified at every level of the application.
Unit Tests: These tests were used to isolate and verify the smallest, most fundamental components of the system. For example, created unit tests for:
Individual tool functions, ensuring they handle inputs and return expected outputs correctly.
Agent-specific functions, like the data ingestion function that validates a CSV's structure or the report generation function that formats a block of text.
Utility functions that perform tasks such as data cleaning or statistical calculations.
Integration Tests: These tests were designed to validate the seamless interaction between different agents within the multi-agent system. Instead of testing agents in isolation, tested the flow of data and state from one agent to the next. For instance, an integration test would simulate the output of the Data Analysis Agent and pass it directly to the Visualization Agent to ensure the input format was correctly interpreted and a visualization was successfully generated. This confirms that the LangGraph orchestration logic is sound and the entire pipeline operates as a cohesive unit.
End-to-End (E2E) System Tests: These are the highest-level tests, designed to simulate a complete user journey. Using a framework like Playwright, automated a virtual browser to:
Wait for the process to complete and verify that a PDF download button appeared and the generated content was correct.
This type of testing provides the highest confidence that the entire system, from the user interface to the backend logic, is working flawlessly.
The system is designed with a strong focus on safety and security. It incorporated multiple guardrails to protect against potential vulnerabilities and ensure a reliable user experience:
Input Validation and Sanitization: Before any data or user prompt is processed, the system validates and sanitizes the input to prevent malicious or malformed data submissions from causing errors or unexpected behavior.
Output Filtering: Content safety measures are implemented to filter and moderate the responses from the Large Language Model (LLM), avoiding unsafe, inappropriate, or biased content in the final report.
Graceful Error Handling: Robust error handling is implemented at every stage of the workflow. Instead of crashing or providing cryptic error codes, the system catches exceptions and presents informative, user-friendly messages. This ensures a consistent and predictable user experience, even when unforeseen issues arise.
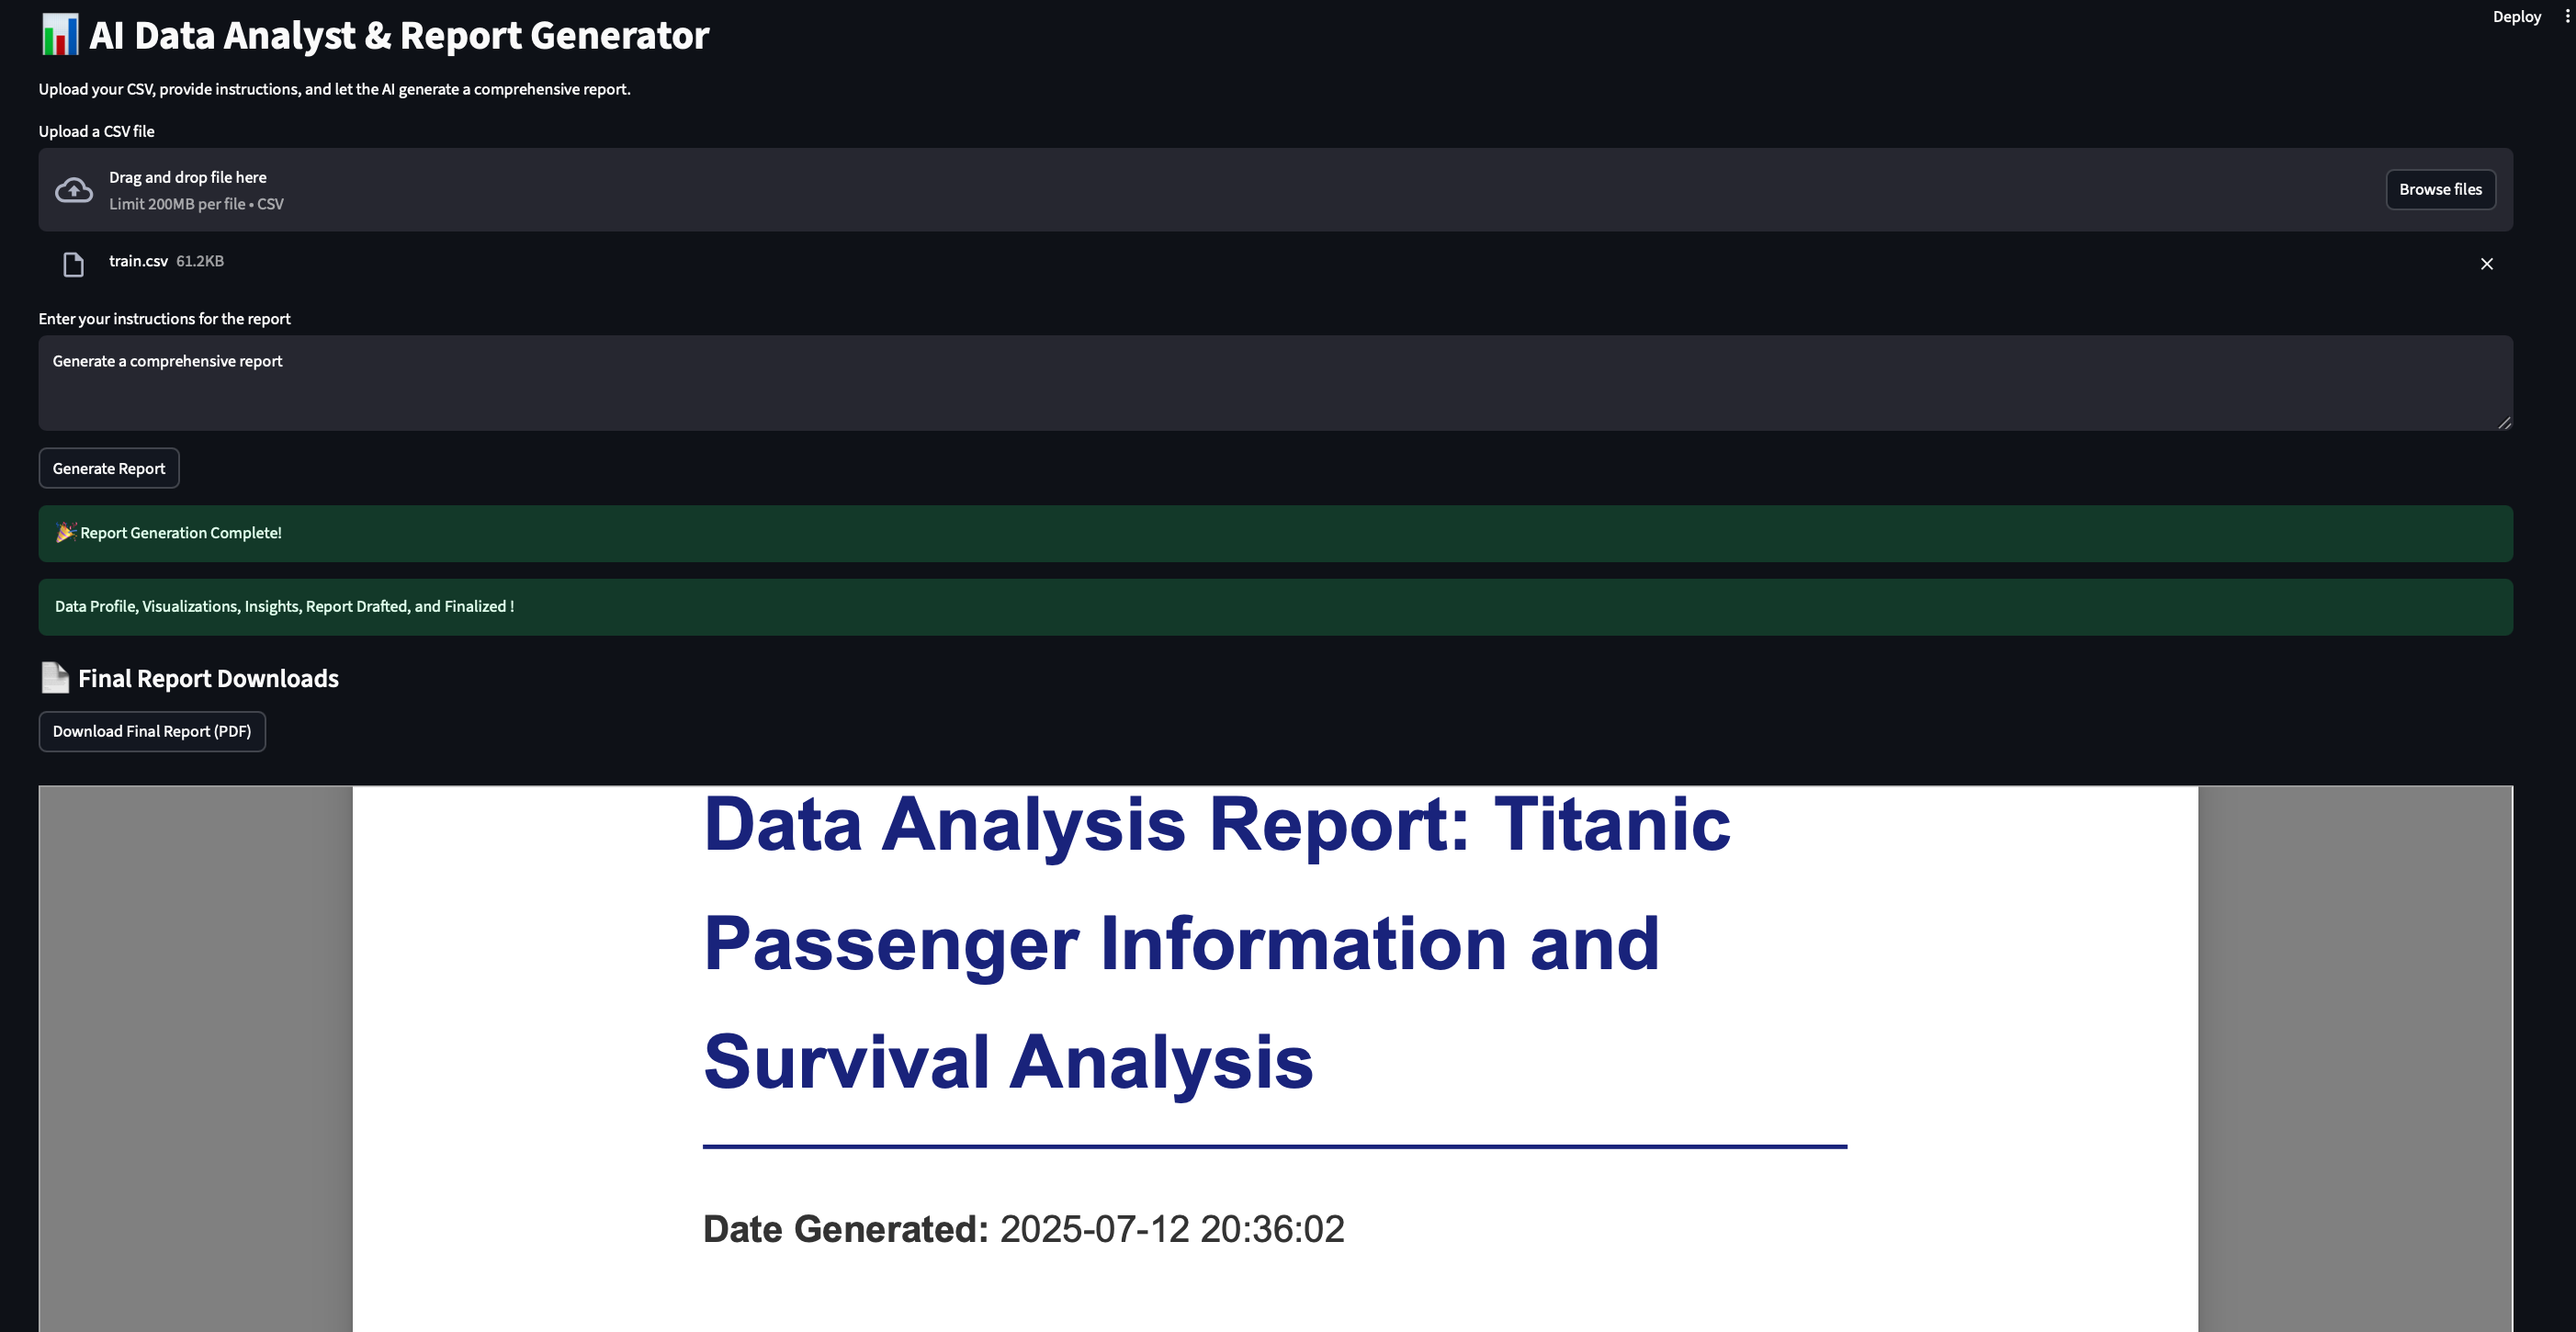
The system features an interactive web application built with Streamlit. This interface is designed to be intuitive and abstracts away technical complexity, making sophisticated data analysis accessible to users without a technical background. The UI provides clear error messages and guidance to assist users throughout the process, ensuring they can easily understand the status of their analysis.
To handle potential failures gracefully and increase reliability, the system includes retry logic with exponential backoff for failed tool or LLM calls. It also uses timeout handling to prevent long-running or stalled workflows from blocking the application. Finally, comprehensive logging for failures, retries, and fallback events is implemented for enhanced debugging and traceability. This ensures that even when errors occur, have the necessary information to diagnose and resolve them.
This automated approach delivers significant advantages over traditional manual data analysis and reporting. It drastically reduces the time and effort needed to generate comprehensive reports, allowing teams to focus on higher-level strategic tasks. The AI-driven pipeline ensures consistency in report structure, formatting, and analytical depth, producing more reliable and professional outputs across different datasets and instructions.
By abstracting away the complexities of coding and statistical tools, the system makes advanced data analysis accessible to non-technical users. Anyone can now obtain meaningful insights and well-structured reports with ease. The platform is designed to highlight and clearly communicate key findings, enabling faster, more informed decision-making.
Its modular, multi-agent architecture—built with LangGraph—ensures the solution is scalable and adaptable. It can easily accommodate larger datasets, new analytical techniques, or evolving business needs. Finally, reports are delivered in high-quality PDF format, making them easy to share and present in professional settings.
Implementing a multi-agent system like the AI Report Generator introduces unique challenges that should be addressed for reliable deployment and long-term maintainability. Understanding these considerations will help practitioners prepare for real-world use.
Common Implementation Challenges
API Rate Limits and Quotas : LLM providers often enforce request limits. High-volume workflows risk hitting these quotas, which can throttle performance or cause failures. A best practice is to implement exponential backoff with retries and reduce redundant calls by caching or batching requests.
Model Latency : Response time from LLMs can significantly affect report generation, especially when handling large datasets. Consider setting realistic expectations for runtime and using smaller, faster models for lightweight tasks, reserving advanced models for complex analysis.
Data Integrity and State Management : Reliable state management is critical in multi-agent systems. Shared state objects (such as GraphState in this project) help maintain consistency but can also become a single point of failure. Use validation and integrity checks at each node to prevent corruption or missing data from breaking the workflow.
Error Propagation : Errors in one node can cascade through the system, making failures difficult to diagnose. To mitigate this, implement node-level error handling with clear, contextual logs so developers can quickly identify and resolve the issue.
Performance and Scalability Considerations
Parallelism vs. Sequential Execution : The current architecture is mostly sequential, where one agent’s output feeds into the next. For independent tasks (e.g., generating multiple plots), parallel execution can reduce total runtime, though it introduces additional complexity in error handling and state synchronization.
Resource and Cost Management : Advanced LLMs are resource-intensive, and frequent calls can be costly. Optimize performance by matching model size to task complexity (e.g., lightweight models for simple tasks, larger models for in-depth analysis). This balances speed, accuracy, and cost efficiency.
This project successfully demonstrates the power of multi-agent systems for automating complex data analysis workflows. The modular design ensures that the system is both scalable and maintainable. The use of Streamlit provides an intuitive and user-friendly front-end, making AI-powered data analysis accessible to a wider audience.
Future improvements could include:
Expanded Data Support: Adding support for a wider range of data sources, such as Excel, JSON, and direct database connections.
Interactive Reports: Integrating interactive elements within the generated PDF reports, such as clickable links or dynamic charts.
Natural Language Customization: Allowing users to provide natural language prompts to guide the analysis, visualizations, or report structure.
This project is licensed under the MIT License, which grants users broad permissions to use, modify, and distribute the software. This license is highly permissive, making it ideal for both commercial and personal use.
Usage Rights & Permissions
Free to Use: You may use this software for any purpose, including commercial projects.
Free to Modify: You can adapt and change the source code to fit your needs.
Free to Distribute: You may share the original software or your modified versions.
Free to Sub-license: You can grant sub-licenses so others can also use and modify the software.
Key Restrictions & Disclaimers
Attribution Required: You must include the original copyright notice and license text in all copies or substantial portions of the software.
No Warranty: The software is provided “as is”, without any warranty.
No Liability: The authors are not liable for any damages that may arise from its use.
Follow these steps to get the project up and running on your local machine.
Prerequisites:
git clone https://github.com/your-username/AI-Report-Generator.git
cd AI-Report-Generator
It's highly recommended to use a virtual environment to manage project dependencies and avoid conflicts with other Python projects.
python -m venv venv
source venv/bin/activate  # On Linux/macOS
# venv\Scripts\activate   # On Windows CMD
# .\venv\Scripts\Activate.ps1 # On Windows PowerShell
pip install -r requirements.txt
GOOGLE_API_KEY="YOUR_GEMINI_API_KEY_HERE"
Run the AI Data Analyst & Report Generator
Open your terminal
Run this command:
streamlit run src/streamlit_app.py
This command will open the AI Data Analyst & Report Generator in your default web browser at http://localhost
Upload Your Data:
In the Streamlit interface, use the file uploader to select your CSV file.
Provide Instructions:
In the text area, enter clear instructions on what you want to analyze or find in
Using the AI Data Analyst & Report Generator is straightforward:
Upload CSV File: On the web interface, use the provided file uploader to select your .csv dataset.
Provide Instructions: In the text area, enter clear and concise instructions on what you want to analyze or what specific insights you are looking for in the data (e.g., "Analyze customer churn drivers," "Summarize sales trends by region," "Identify key demographics of high-value customers").
Start Analysis: Click the "Generate Report" button. The application will then begin processing the data through its multi-agent pipeline. A spinner will indicate progress.
View Report: Once the analysis is complete, you will see a preview of the generated PDF report directly in the application.
Download Report: Convenient download buttons will appear at the bottom of the page, allowing you to save the complete report in PDF format.
To ensure the project is working as expected and to verify any changes you make, you can run the test suite. This section provides instructions on how to execute tests and view coverage reports.
To run the entire test suite, use the following command from the root directory of the project:
PYTHONPATH=./src pytest
The PYTHONPATH=./src part of this command temporarily adds the project's src directory to Python's import path. This ensures that the test runner can correctly find and import the source code modules it needs to test.
Running Specific Tests
If you are working on a particular feature or bug and only want to run a specific test file, you can do so by providing the file path:
PYTHONPATH=./src pytest path/to/your/test-file.py
This project is actively maintained. We welcome contributions, bug reports, and feature requests.
Project Status: Actively Maintained\
Bug Reports & Feature Requests: Please open an issue on the GitHub Issues page.
General Inquiries: For direct questions or collaborations, you can reach out via the contact information below.
Response Time: Strive to address critical bugs and integrate valuable enhancements in a timely manner, though response times may vary.
For questions, feedback, or collaborations, please reach out to:
archanags001@gmail.com