This project introduces an AI-powered system that automates the entire data analysis and report generation process. It transforms raw data into clear, professional reports, complete with visualizations and key insights. Our system leverages a multi-agent architecture orchestrated by LangGraph, integrating robust tools like Pandas, Matplotlib, Seaborn, and WeasyPrint. This automation significantly reduces manual effort and time, allowing users to quickly derive actionable value from their data and focus on strategic decision-making.
In today's rapidly evolving business landscape, data is an invaluable asset. However, the journey from raw data to actionable insights is often complex, time-consuming, and resource-intensive. Traditional data analysis involves manual steps for data preparation, iterative visualization, and the laborious process of drafting comprehensive reports. This project directly addresses these bottlenecks by presenting an innovative AI-powered solution that fully automates this workflow. Our system is designed to democratize sophisticated data analysis, enabling users across various domains to generate consistent, high-quality, and professional reports efficiently, without requiring deep technical expertise.
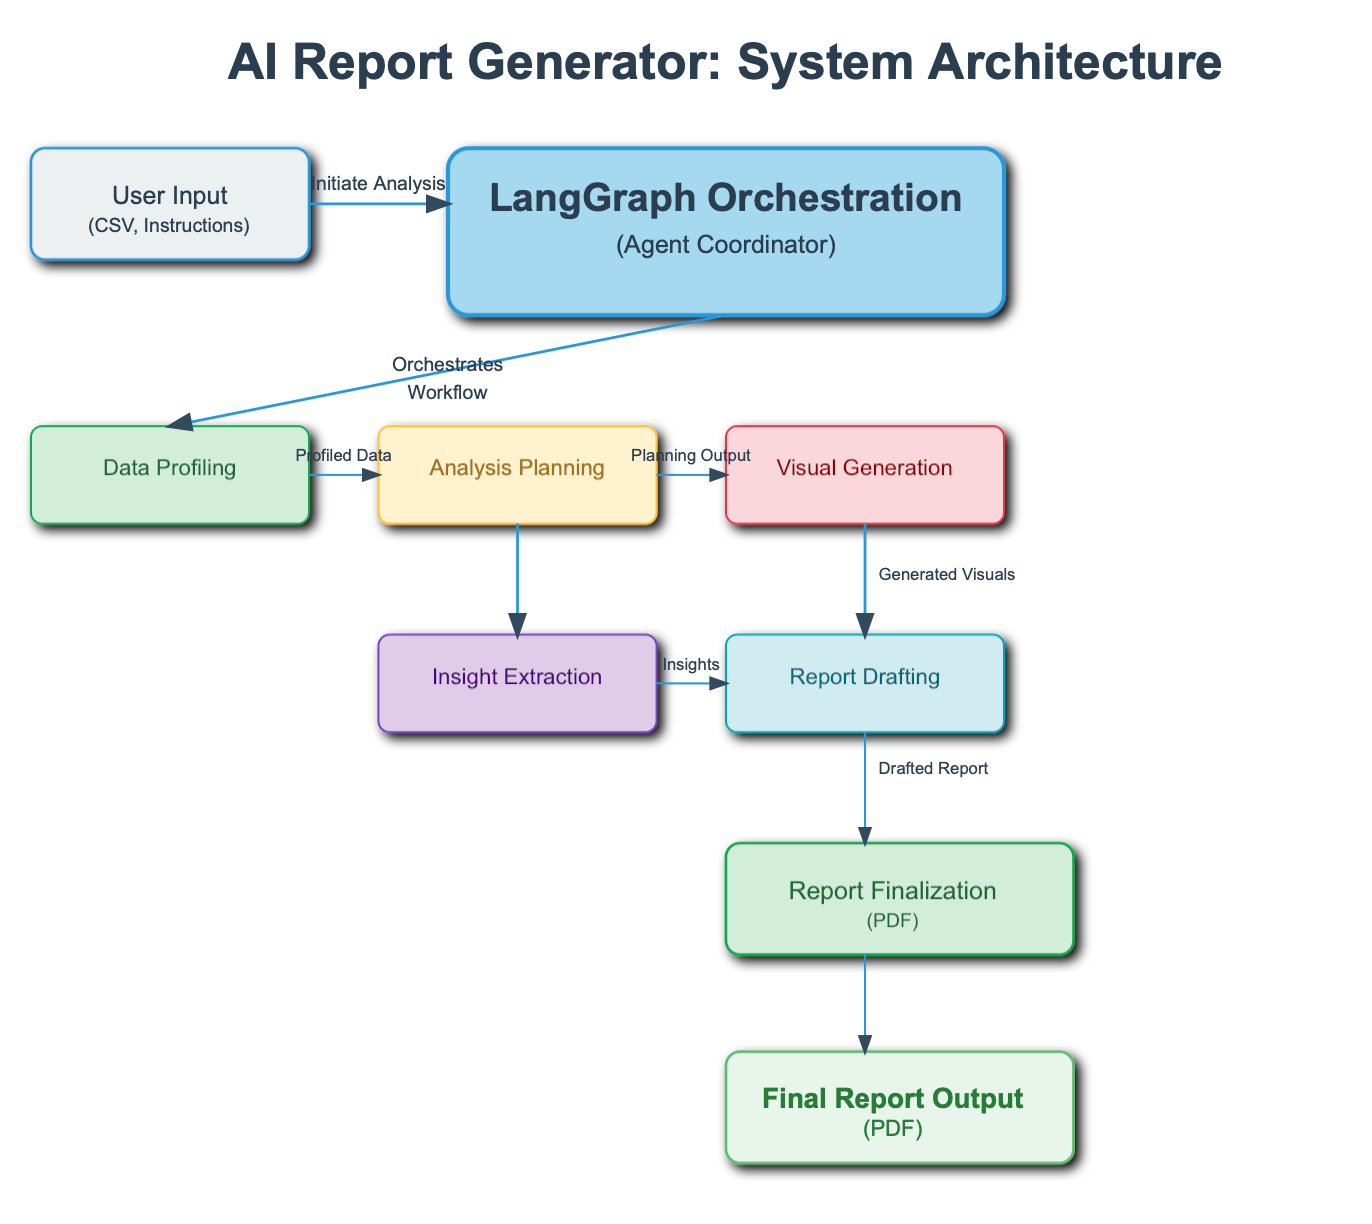
The system executes a comprehensive, sequential, and automated methodology, guiding the data from initial ingestion through to the delivery of a finalized report:
[FIGURE 1]), summarizes the main conclusions as concise key takeaways, and formulates a clear, forward-looking conclusion.langchain-google-genai)This automated approach delivers significant advantages over traditional manual data analysis and reporting. It drastically reduces the time and effort needed to generate comprehensive reports, allowing teams to focus on higher-level strategic tasks. The AI-driven pipeline ensures consistency in report structure, formatting, and analytical depth, producing more reliable and professional outputs across different datasets and instructions.
By abstracting away the complexities of coding and statistical tools, the system makes advanced data analysis accessible to non-technical users. Anyone can now obtain meaningful insights and well-structured reports with ease. The platform is designed to highlight and clearly communicate key findings, enabling faster, more informed decision-making.
Its modular, multi-agent architecture—built with LangGraph—ensures the solution is scalable and adaptable. It can easily accommodate larger datasets, new analytical techniques, or evolving business needs. Finally, reports are delivered in high-quality PDF format, making them easy to share and present in professional settings.
This project successfully demonstrates an automated, AI-powered system for data analysis and report generation. By leveraging a multi-agent architecture orchestrated by LangGraph and integrating powerful tools, we have built a solution that significantly streamlines the process of transforming raw data into actionable insights. This system enhances efficiency, ensures consistent quality, and makes sophisticated data analysis accessible to a broader audience. The ability to generate comprehensive reports with visualizations and clear narratives automatically represents a notable step forward in data-driven decision-making.
Follow these steps to get the project up and running on your local machine.
Prerequisites:
git clone https://github.com/your-username/AI-Report-Generator.git
cd AI-Report-Generator
It's highly recommended to use a virtual environment to manage project dependencies and avoid conflicts with other Python projects.
python -m venv venv
source venv/bin/activate  # On Linux/macOS
# venv\Scripts\activate   # On Windows CMD
# .\venv\Scripts\Activate.ps1 # On Windows PowerShell
pip install -r requirements.txt
GOOGLE_API_KEY="YOUR_GEMINI_API_KEY_HERE"
Run the AI Data Analyst & Report Generator
Open your terminal
Run this command:
streamlit run src/streamlit_app.py
This command will open the AI Data Analyst & Report Generator in your default web browser at http://localhost
Upload Your Data:
In the Streamlit interface, use the file uploader to select your CSV file.
Provide Instructions:
In the text area, enter clear instructions on what you want to analyze or find in
Using the AI Data Analyst & Report Generator is straightforward:
Upload CSV File: On the web interface, use the provided file uploader to select your .csv dataset.
Provide Instructions: In the text area, enter clear and concise instructions on what you want to analyze or what specific insights you are looking for in the data (e.g., "Analyze customer churn drivers," "Summarize sales trends by region," "Identify key demographics of high-value customers").
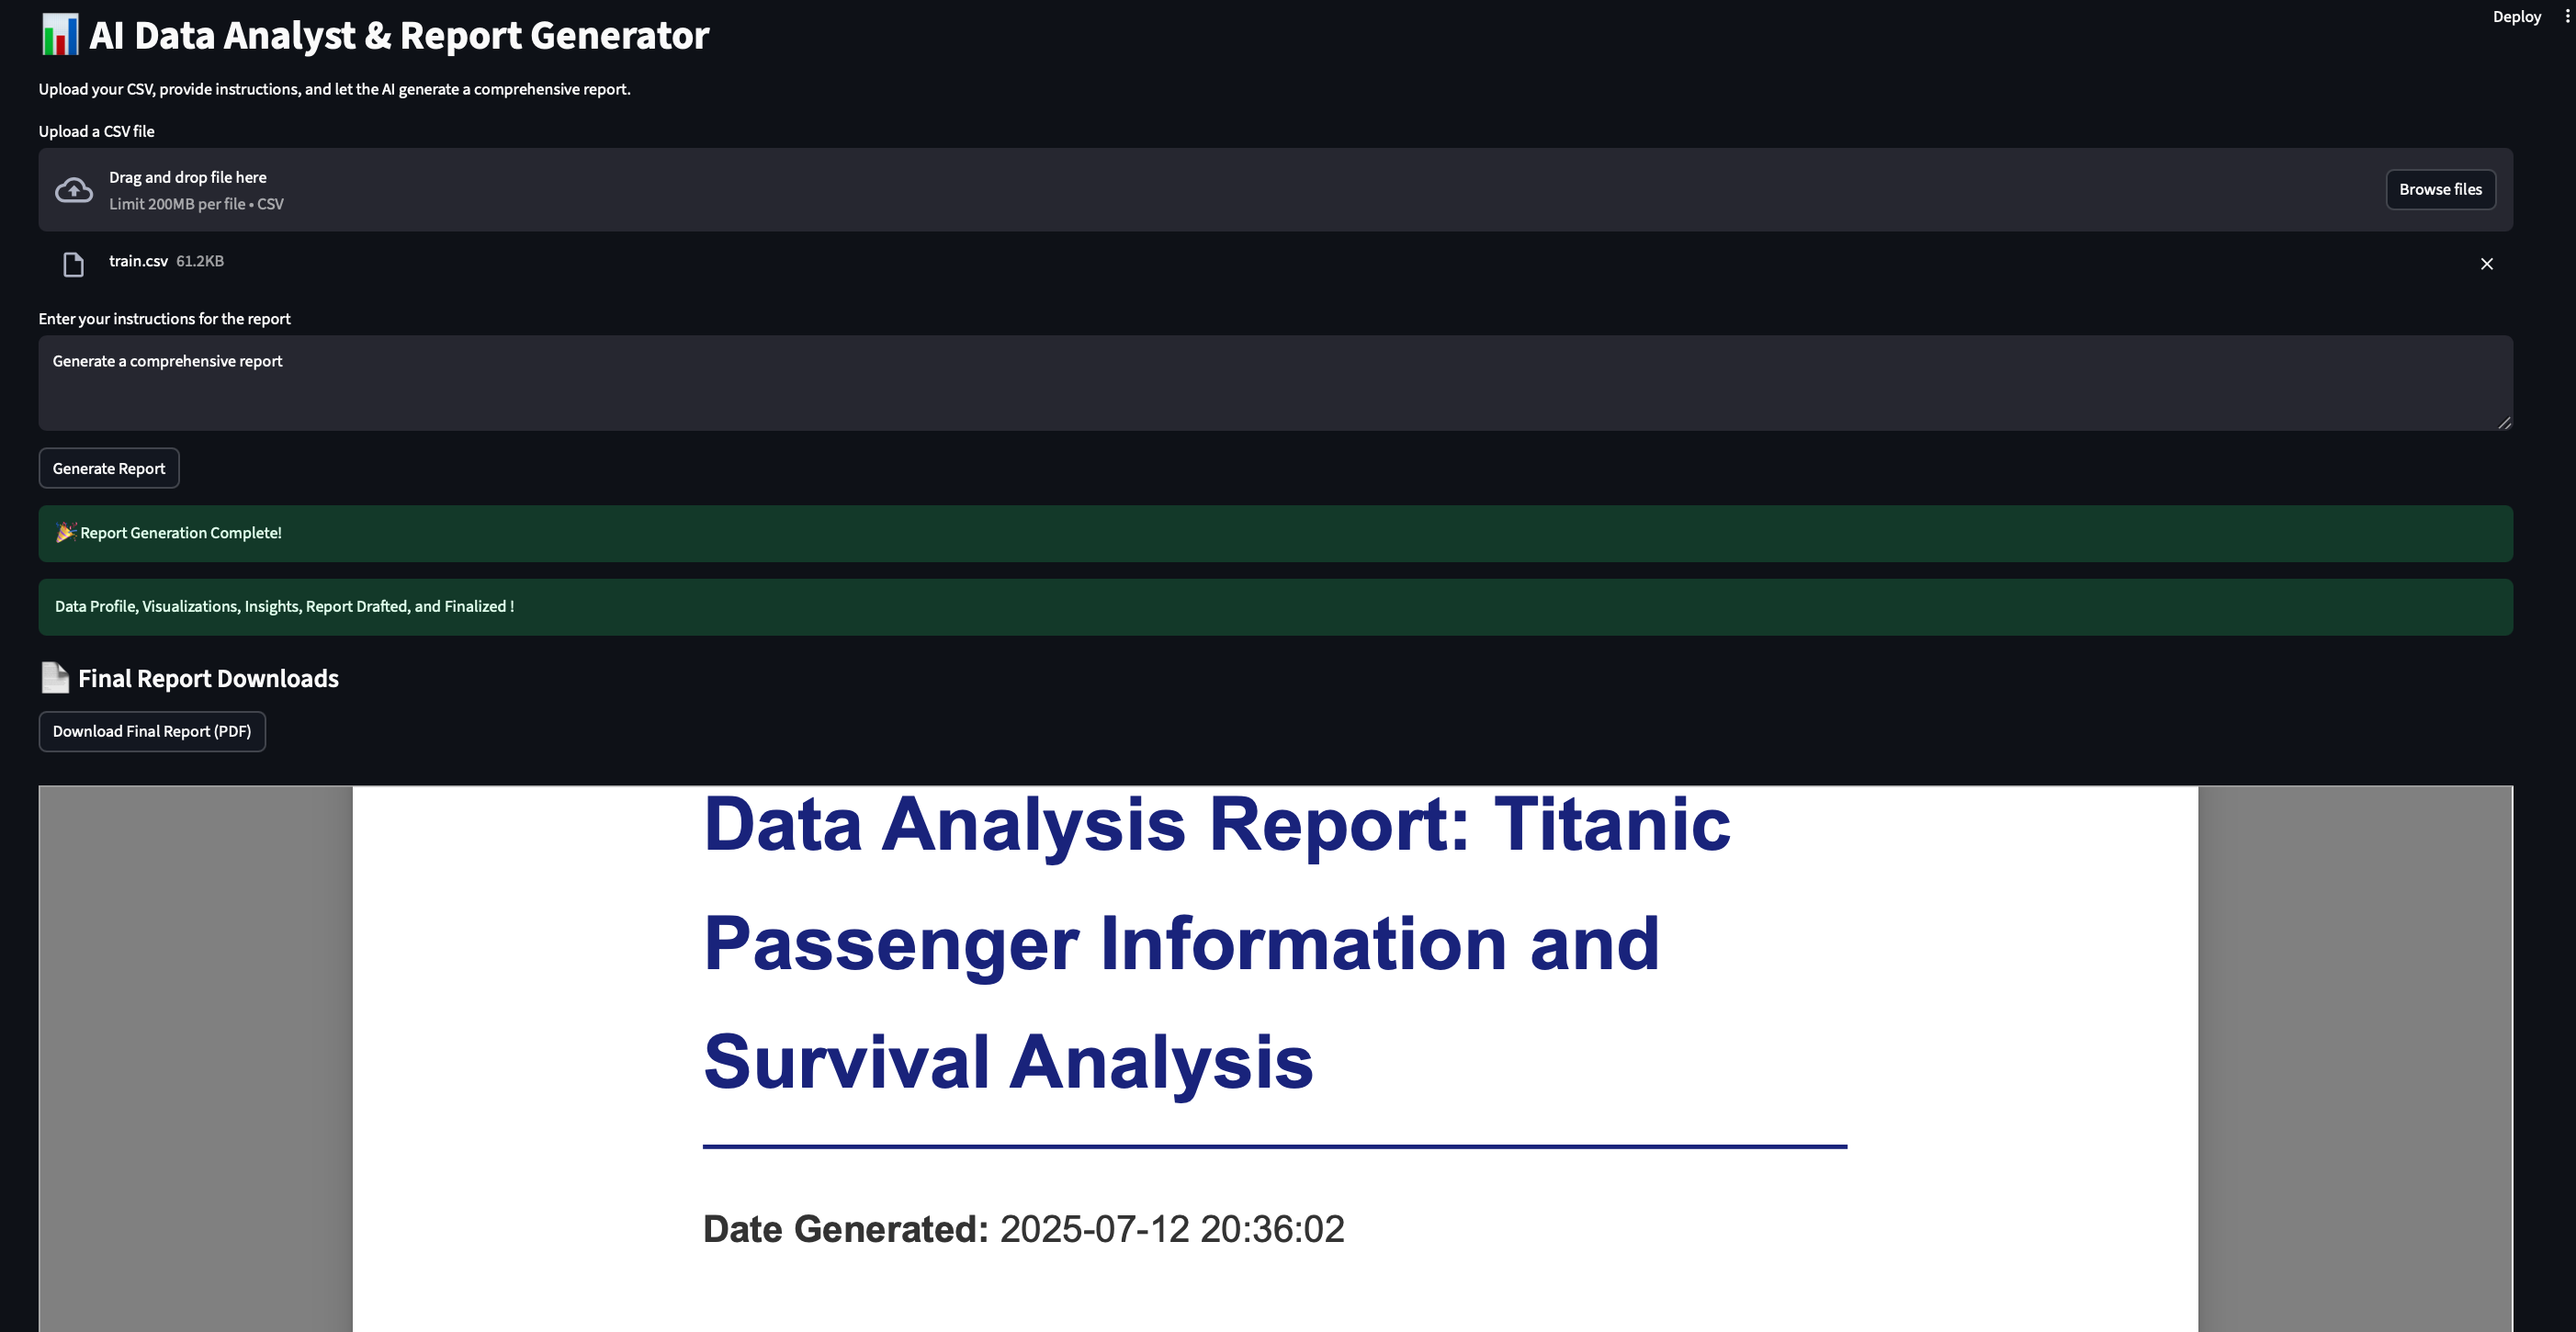
Start Analysis: Click the "Generate Report" button. The application will then begin processing the data through its multi-agent pipeline. A spinner will indicate progress.
View Report: Once the analysis is complete, you will see a preview of the generated PDF report directly in the application.
Download Report: Convenient download buttons will appear at the bottom of the page, allowing you to save the complete report in PDF format.
This project is actively maintained. We welcome contributions, bug reports, and feature requests.
Project Status: Actively Maintained\
Bug Reports & Feature Requests: Please open an issue on the GitHub Issues page.
General Inquiries: For direct questions or collaborations, you can reach out via the contact information below.
Response Time: Strive to address critical bugs and integrate valuable enhancements in a timely manner, though response times may vary.
This project is licensed under the MIT License – see the LICENSE file for details.
For questions, feedback, or collaborations, please reach out to:
archanags001@gmail.com