⬅️ Previous - What to Monitor & Observe
➡️ Next - Troubleshooting Failures in Agentic AI
Monitoring and observability tools are essential for understanding, debugging, and improving agentic AI systems in production. This lesson walks you through the major categories — AI-native platforms, hosted observability stacks, and open-source tools — and helps you pick the right one based on your needs, infrastructure, and compliance requirements. Whether you're using LangSmith or building with OpenTelemetry, you'll learn how to gain visibility into your system’s behavior, not just its uptime.
In the last lesson, you learned what to monitor in agentic AI systems — from hallucinations and incomplete outputs to silent failures caused by tool errors, retrieval issues, or state corruption. You now know how to track these failures using the right mix of metrics, logs, and traces.
But knowing what to monitor is only half the battle.
The next challenge is figuring out how to monitor it — and with which tools.
This lesson introduces the tools that bring your observability plans to life. We’ll look at which platforms offer deep tracing, which ones plug cleanly into LLM workflows, and how to balance speed, control, and compliance as you scale.
Let’s dive in.
There’s no single “best” tool for monitoring agentic systems — but most setups fall into three categories. Your choice depends on how tightly you want to integrate, how much control you need, and whether you prefer managed platforms or custom setups.
Just like agentic AI breaks traditional monitoring assumptions, it also reshapes the tooling landscape. You're not just logging API failures — you're tracing decisions, inspecting prompts, and catching issues like hallucinations, tool misfires, or safety violations.
That’s why tools for agentic AI fall into three broad buckets:
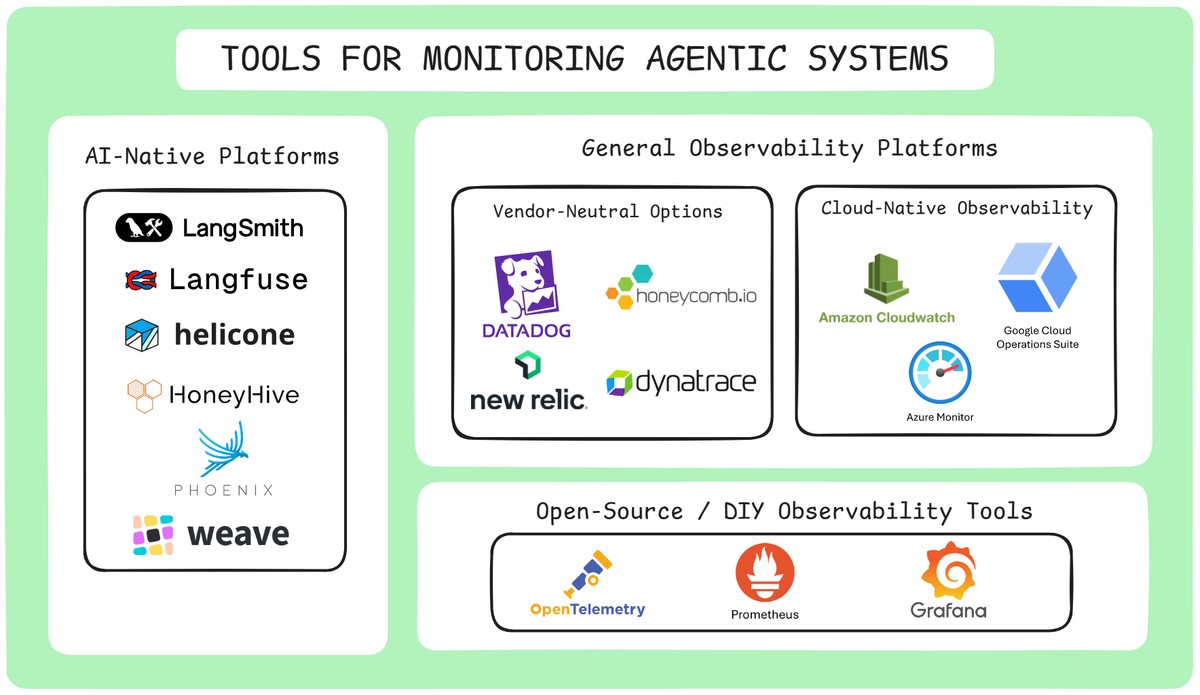
These platforms are purpose-built for LLM and agentic systems. They automatically log prompts, responses, tool usage, traces, and metadata — giving you a high-resolution view into how your agent is behaving.
Examples:
These tools are great if you want quick, meaningful visibility without building custom infrastructure.
But keep in mind:
If you're okay with managed services and want fast insights into how your agentic system is performing, this category is a strong starting point.
If you haven’t seen it yet, our Week 5, Lesson 3 features a hands-on walkthrough of LangSmith — one of the most powerful tracing tools available for agentic AI systems.
In the video, we use LangSmith to inspect an actual agent built in the program. You’ll see how it lets you:
If you're evaluating AI-native monitoring platforms, this demo gives a clear picture of what deep agent observability looks like in practice.
These platforms weren’t purpose-built for LLMs — but they’re powerful, scalable, and already battle-tested in traditional software systems. You can track custom metrics, emit logs and traces, and tie AI system health to your broader infrastructure.
Examples: Datadog, New Relic, Honeycomb
These are vendor-managed tools with rich UIs, prebuilt dashboards, and OpenTelemetry support. Great for fast setup, enterprise SLAs, and integrating AI observability into broader system dashboards.
Pros: Quick to deploy, polished UX, alerting and correlation built in
Cons: Less opinionated about agent workflows. You’ll need to define your own trace schemas and semantic metrics.
If you're running your agents in AWS, GCP, or Azure, their native tools offer tight integration and low setup friction:
These support logs, metrics, and traces — and work well with OpenTelemetry for custom agentic data.
Pros: Built-in with your cloud, secure by default, and great for cost observability.
Cons: Often minimal UI for deep debugging, and not tailored to LLM-specific failure modes.
Prefer control over convenience? Build your own observability stack using open-source tools. These solutions give you flexibility, data ownership, and customization — but require more engineering investment.
This stack is ideal for mature teams or high-compliance environments where control, privacy, and customization matter.
Pros: Fully customizable, open-source, no vendor lock-in
Cons: Requires setup, schema design, infra maintenance, and observability expertise
The platforms and tools listed above are certainly not exhaustive, but they represent the most common approaches to monitoring and observability in agentic AI systems. The right choice depends on your specific needs, existing infrastructure, and team expertise.
Selecting the right monitoring and observability tool depends on your system’s complexity, compliance needs, and operational priorities. Here are key factors to guide your decision:
💡 If you're just getting started, prioritize visibility and alerting — then layer in compliance, cost controls, and scale as your system matures.
It’s easy to get caught up comparing dashboards, pricing tiers, or which tool integrates best with your stack. But at the end of the day, your observability stack isn’t about logos — it’s about insight.
Can you trace what your system did — and why? Can you catch failures before users do — even if nothing crashes?
That’s what separates reliable systems from fragile ones.
In production, success often hinges on your ability to track what's happening — and explain why.
⬅️ Previous - What to Monitor & Observe
➡️ Next - Troubleshooting Failures in Agentic AI