Yesterday we established that:
Sound = vibration of air pressure over time
Digitization = sampling + quantization + encoding
After digitization, we have a sequence of numbers x[n], This is the waveform.
It represents Amplitude vs Time, but speech is not just amplitude changes. Speech is a combination of frequencies. So today we answer: “How do we see the frequencies inside a waveform?”
Understanding the Simplest Sound: A Single Sine Wave which is the simplest possible signal.

A sine wave Repeats perfectly, Has one frequency, Has one amplitude, Has one phase
If one cycle takes 0.01 seconds: f=1//0.01 = Hz
This means: 100 cycles per second.A single sine wave contains exactly one frequency..Nothing else.
You can look at it as the “atom” of vibration.
Waveform Properties (Time Domain): When you plot digitial audio, you see:
What Can We See in Time Domain?
Limitation of the Time Domain
If someone plays 200 Hz tone, 400 Hz tone and 800 Hz tone at the same time the waveform becomes complicated and difficult to interpret even though it is just three simple sine waves added together (superposition) you cannot easily see “What frequencies are present?” “How strong is each one?” You only see a messy curve. We need a way to separate the ingredients because speech it self is not a single sine wave.
Core Idea Behind the Fourier Transform
![]()
Here is the fundamental truth any complex periodic signal can be expressed as a sum of sine and cosine waves. This is Fourier’s Theorem. The Fourier Transform is a mathematical tool that transforms a signal from the time domain (how it changes over time) to the frequency domain (how much of each frequency is present in the signal). That means Speech. Music, Noise can all be decomposed into pure sine waves. Since sine waves contain one frequency each, If we can measure how much of each sine wave exists then we can understand the signal’s frequency content. That is exactly what the Fourier Transform does.
Why is the Fourier Transform Useful?
The reason the Fourier Transform is so powerful is that many complex signals, like sound, can be represented as a sum of simpler, pure sine waves. Each sine wave has a specific frequency, amplitude, and phase.
So, instead of analyzing a complicated signal directly, we can analyze it by looking at the individual sine waves that make it up.
For example, if you're listening to a song, there are many different frequencies (like bass, mid-range, and treble). The Fourier Transform helps us separate and identify these different frequencies.
How Fourier Transform works
Given a digital signal: x[n], The Fourier Transform asks “How similar is this signal to a sine wave at frequency f?”
(picture of the fouirer transform formular)
For each frequency:
If that frequency exists in the signal: The result is large
If it does not: The result is near zero
Repeating this for many frequencies gives: X(f)
This is the frequency spectrum.
Now we plot:
We have moved from Amplitude vs Time to Amplitude vs Frequency.
Fourier Transform is essentially a Frequency detector, It scans through possible frequencies and measures: “How strong is this frequency inside the signal?”
Example: Fourier Transform of a Pure Tone
Let’s take an example of a pure sine wave of 100 Hz. In the time domain, it looks like this: A smooth, oscillating wave (it repeats every 0.01 seconds, because 100 Hz = 1/0.01).
If you apply the Fourier Transform to this pure sine wave, the result will show: A single peak at 100 Hz in the frequency domain, indicating that the signal contains only one frequency: 100 Hz.
This is simple because a pure sine wave has just one frequency.
Real-World Application
But, in real-life signals like speech, the sound is made up of many frequencies, so the Fourier Transform is essential to analyze all of them. For example, if you listen to speech, you don’t hear a single pure tone. Instead, you hear a combination of frequencies that change over time (the vowels, consonants, etc.).
The Fourier Transform helps separate these frequencies and analyze how they evolve, making it much easier to study the structure of the sound.
Discrete Fourier Transform (DFT)
In digital systems, we use the Discrete Fourier Transform (DFT) because our signal is sampled.
If we have N samples: The DFT gives N frequency bins where each bin represents: A specific frequency component. Computing DFT directly costs: O(N2) but using the Fast Fourier Transform (FFT) algorithm: O(NlogN). This efficiency makes real-time speech processing possible.
The Big Problem: Speech Changes Over Time
The standard Fourier Transform analyzes the entire signal at once. That assumes the signal is: Stationary (its frequency content does not change). But speech is non-stationary. When you say: “hello”. The frequency content of “he” is different from “llo”.
If we analyze the whole word at once we know what frequencies exist overall but we lose information about when they occur.
To fix this, we assume speech is approximately stationary over short windows (20–25 ms): This is Short Fourier Transform.
So we:
This produces: X(t, f), Now we have frequency information at each moment in time.
Important parameters:
The window function reduces spectral leakage by smoothing edges.
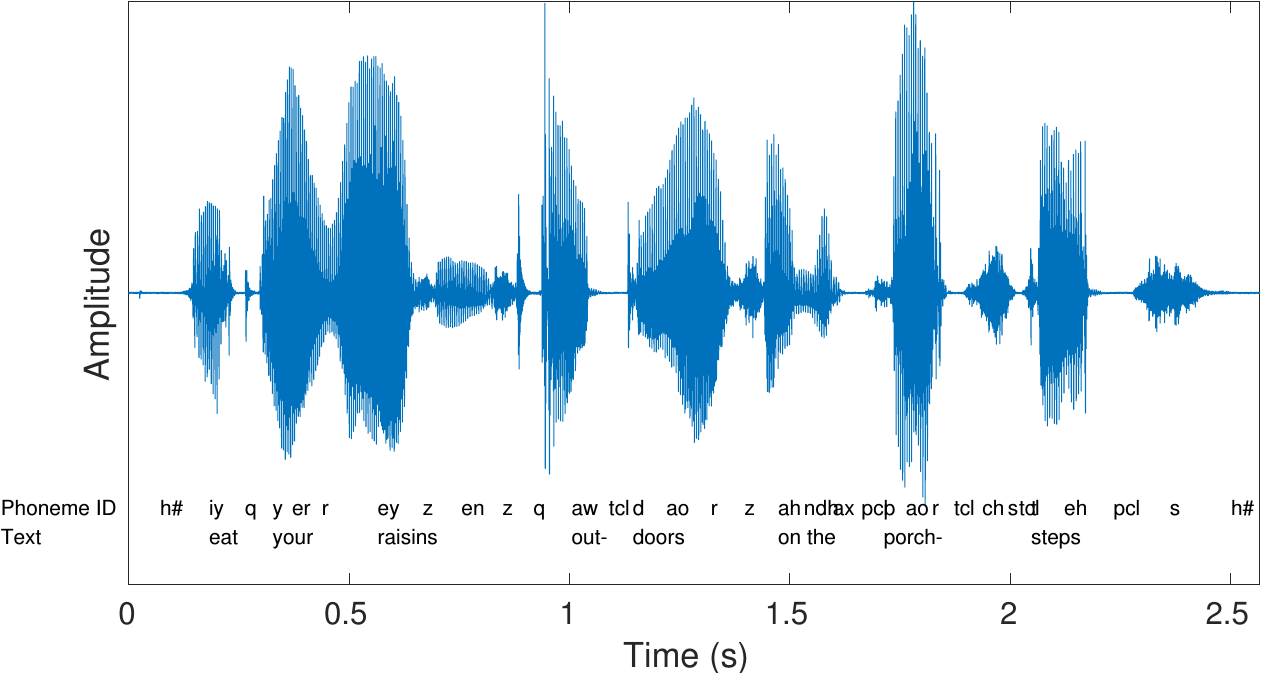
Spectrogram: Making It Visual
The magnitude of the STFT can be displayed as an image. This is called spectogram.
(image of spectrogram)
Axes:
Quick Links
