A comprehensive big data pipeline for real-time sentiment analysis of YouTube live chat messages, combining Apache Kafka, Apache HBase, MySQL, and Metabase.
This project implements a sophisticated big data pipeline for real-time sentiment analysis of YouTube live chat messages. It demonstrates key concepts in distributed systems, data streaming, storage, and analytics.
The system captures comments from YouTube live streams in real-time, processes each message through sentiment analysis, and makes the results available for real-time monitoring and visualization, allowing content creators and moderators to understand audience sentiment during live events.
The project follows a modular microservices architecture:
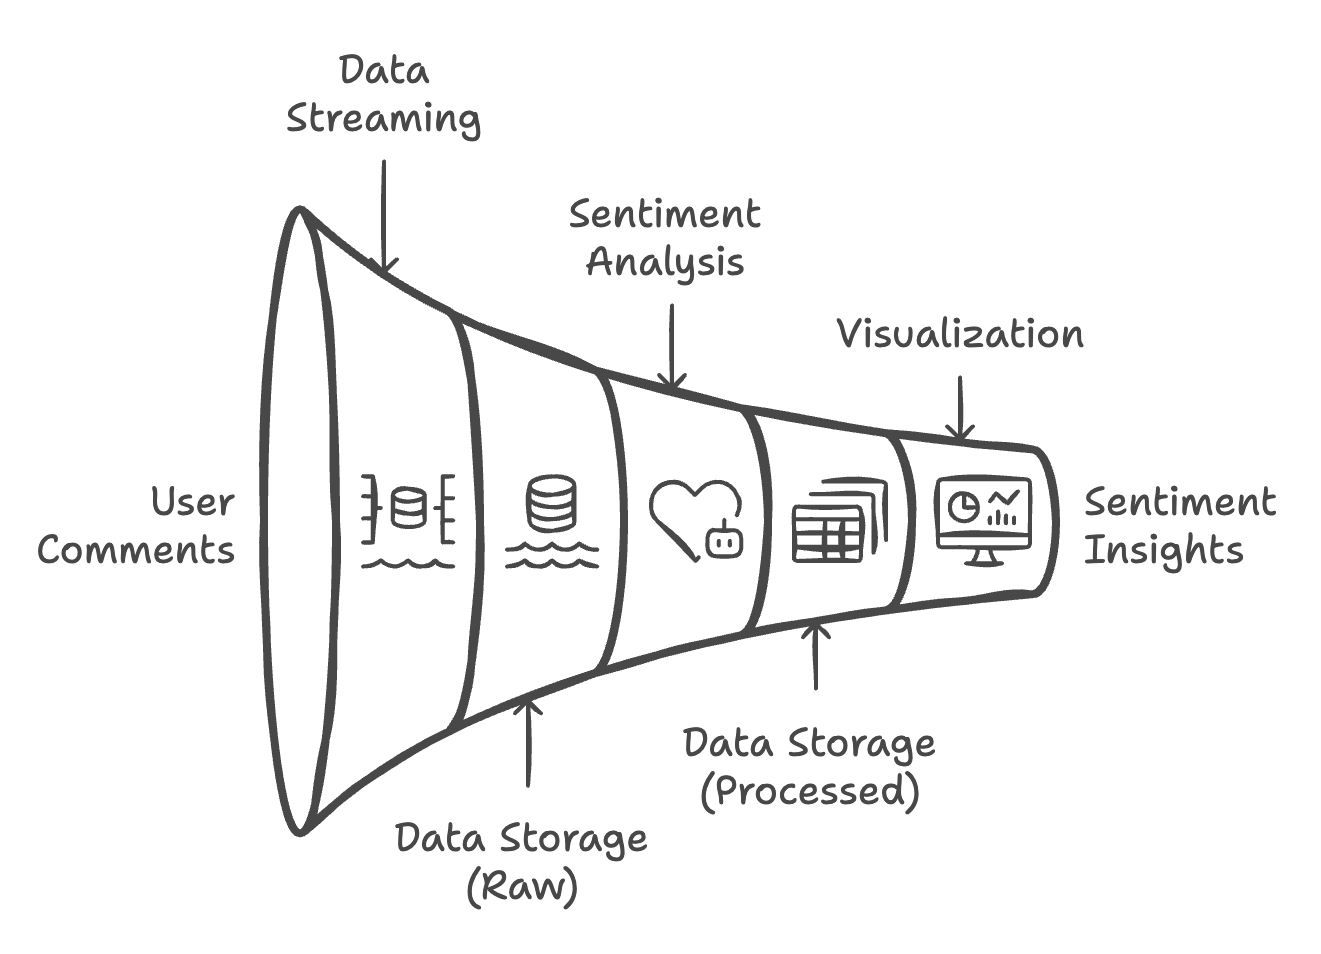
Figure 1: High-level architecture showing data flow between components in the sentiment analysis pipeline
Data Flow:
git clone https://github.com/alonsarias/youtube-sentiment-pipeline.git
cd youtube-sentiment-pipeline
pip install -r requirements.txt
docker-compose up -d
This command starts all necessary services: ZooKeeper, Kafka, HBase, MySQL, and Metabase.
docker-compose ps
All services should have a "running" state.
The project uses Docker Compose to orchestrate multiple containers. The docker-compose.yml file defines the following services:
Running Docker Commands:
# Start all services
docker-compose up -d

# Stop all services
docker-compose down

# View logs from all services
docker-compose logs

# View logs from a specific service
docker-compose logs kafka
Purpose: Provides distributed configuration and synchronization service.
Implementation: Uses the official Confluent ZooKeeper image configured for Apple Silicon compatibility.
Configuration:
Verification:
# Test ZooKeeper connection
echo ruok | nc localhost 2181
# Should respond with "imok"
Purpose: Distributed event streaming platform that handles the real-time comment stream.
Implementation: Uses Confluent's Kafka image with multi-listener setup for both internal and external connections.
Configuration:
Kafka Commands:
# List topics
docker exec kafka kafka-topics --bootstrap-server localhost:9092 --list

# Create a topic manually (if needed)
docker exec kafka kafka-topics --bootstrap-server localhost:9092 --create --topic comments --partitions 1 --replication-factor 1

# Consume messages from the topic (for debugging)
docker exec kafka kafka-console-consumer --bootstrap-server localhost:9092 --topic comments --from-beginning
Purpose: NoSQL database for storing raw comment data.
Implementation: Uses HBase in standalone mode, connected to the ZooKeeper service.
Configuration:
HBase Tables:
comments: Stores raw comment data
datauser_id, comment, sentimentHBase Commands:
# Access HBase shell
docker exec -it hbase hbase shell

# List tables
list

# Scan comments table (view data)
scan 'comments', {LIMIT => 10}
Purpose: Relational database for storing processed sentiment results.
Implementation: Uses MySQL 8.0 with native authentication for easier client connectivity.
Configuration:
Schema:
sentiment_results table: Stores sentiment analysis results
row_key: Unique identifier (primary key)user_id: User identifiercomment_text: Original comment texttimestamp: Comment timestampsentiment: Sentiment classificationsentiment_score: Optional confidence scoreMySQL Commands:
# Connect to MySQL
docker exec -it mysql mysql -u user -ppassword sentiment_analysis

# View sentiment results
SELECT * FROM sentiment_results LIMIT 10;

# Get sentiment distribution
SELECT sentiment, COUNT(*) FROM sentiment_results GROUP BY sentiment;
Purpose: Data visualization and dashboarding platform.
Implementation: Uses the official Metabase image, connected to MySQL.
Configuration:
Setup Instructions:
producer.py)Purpose: Streams YouTube live chat messages to Kafka for real-time sentiment analysis.
Implementation: Connects to the YouTube Data API to retrieve live chat messages from ongoing streams and sends them to Kafka for processing.
Configuration:
.env fileYouTube API Configuration:
To use the Producer with YouTube live chats, you need to:
.env file as YOUTUBE_API_KEY=your_key_hereYOUTUBE_POLL_INTERVAL (seconds, default: 5)YOUTUBE_MAX_RESULTS (default: 200)Running the Producer:
# Specify a YouTube video ID as command line argument
python src/producer.py <youtube_video_id>
Key Features:
consumer.py)Purpose: Processes comment streams, coordinates sentiment analysis, and stores results.
Implementation: Consumes messages from Kafka, orchestrates sentiment analysis, and manages data storage in both HBase and MySQL.
Running the Consumer:
python src/consumer.py
sentiment_analyzer.py)Purpose: Performs sentiment analysis on comment text.
Implementation: Uses a pre-trained transformer model from Hugging Face to classify sentiment.
Model Details:
config.py)Purpose: Centralizes configuration for all components.
Implementation: Uses environment variables with sensible defaults.
Environment Variables:
KAFKA_BOOTSTRAP_SERVERS, KAFKA_TOPIC, etc.HBASE_HOST, HBASE_PORT, etc.MYSQL_HOST, MYSQL_DATABASE, etc.SENTIMENT_MODEL_NAME, etc.youtube-sentiment-pipeline/
├── docker-compose.yml # Docker services configuration
├── requirements.txt # Python dependencies
├── .env # Environment variables configuration
├── README.md # Project documentation
├── LICENSE # MIT License file
└── src/
│ ├── config.py # Centralized configuration
│ ├── consumer.py # Kafka consumer and orchestration
│ ├── hbase_utils.py # HBase database utilities
│ ├── mysql_client.py # MySQL database utilities
│ ├── producer.py # Streams YouTube live chat messages to Kafka using the YouTube Data API
│ ├── sentiment_analyzer.py # ML-based sentiment analysis
│ └── sentiment_processor.py # Sentiment processing orchestration
└── images/ # Visualization and diagram assets
├── system_architecture.png # System architecture diagram
├── bar_chart_visualization.png # Bar chart of sentiment distribution
├── pie_chart_visualization.png # Pie chart of sentiment percentages
└── time_series_visualization.png # Time series of sentiment trends
Root Directory: Contains project-level configuration files and documentation
docker-compose.yml: Defines and configures all Docker services needed for the projectrequirements.txt: Lists Python dependencies needed for the application components.env: Environment variables configuration file for all services and componentsREADME.md: Project documentation with setup instructions and component explanationsLICENSE: MIT License filesrc/: Contains all application source code, organized by component function
Data Pipeline:
producer.py: Streams YouTube live chat messages to Kafka using the YouTube Data APIconsumer.py: Consumes comment data from Kafka and coordinates processingData Processing:
sentiment_analyzer.py: Implements ML model-based sentiment analysis logicsentiment_processor.py: Orchestrates the sentiment analysis and storage workflowData Storage:
hbase_utils.py: Provides functions to interact with HBase for raw comment storagemysql_client.py: Provides functions to interact with MySQL for sentiment result storageConfiguration:
config.py: Centralizes configuration for all components via environment variablesimages/: Contains visualization assets and diagrams
system_architecture.png: High-level system architecture diagramtime_series_visualization.png: Example of time series sentiment analysis chartbar_chart_visualization.png: Example of sentiment distribution bar chartpie_chart_visualization.png: Example of sentiment distribution pie chartThe project follows a modular architecture with clear separation of concerns between data ingestion, processing, and storage components. This structure makes it easy to understand the data flow and modify individual components as needed.
# Start all services
docker-compose up -d

# Wait for services to initialize (approximately 1-2 minutes)
# In one terminal
python src/consumer.py
# In another terminal
python src/producer.py <youtube_video_id>
Here are step-by-step examples to create useful visualizations for monitoring sentiment analysis:
This visualization shows how sentiment trends change over time.
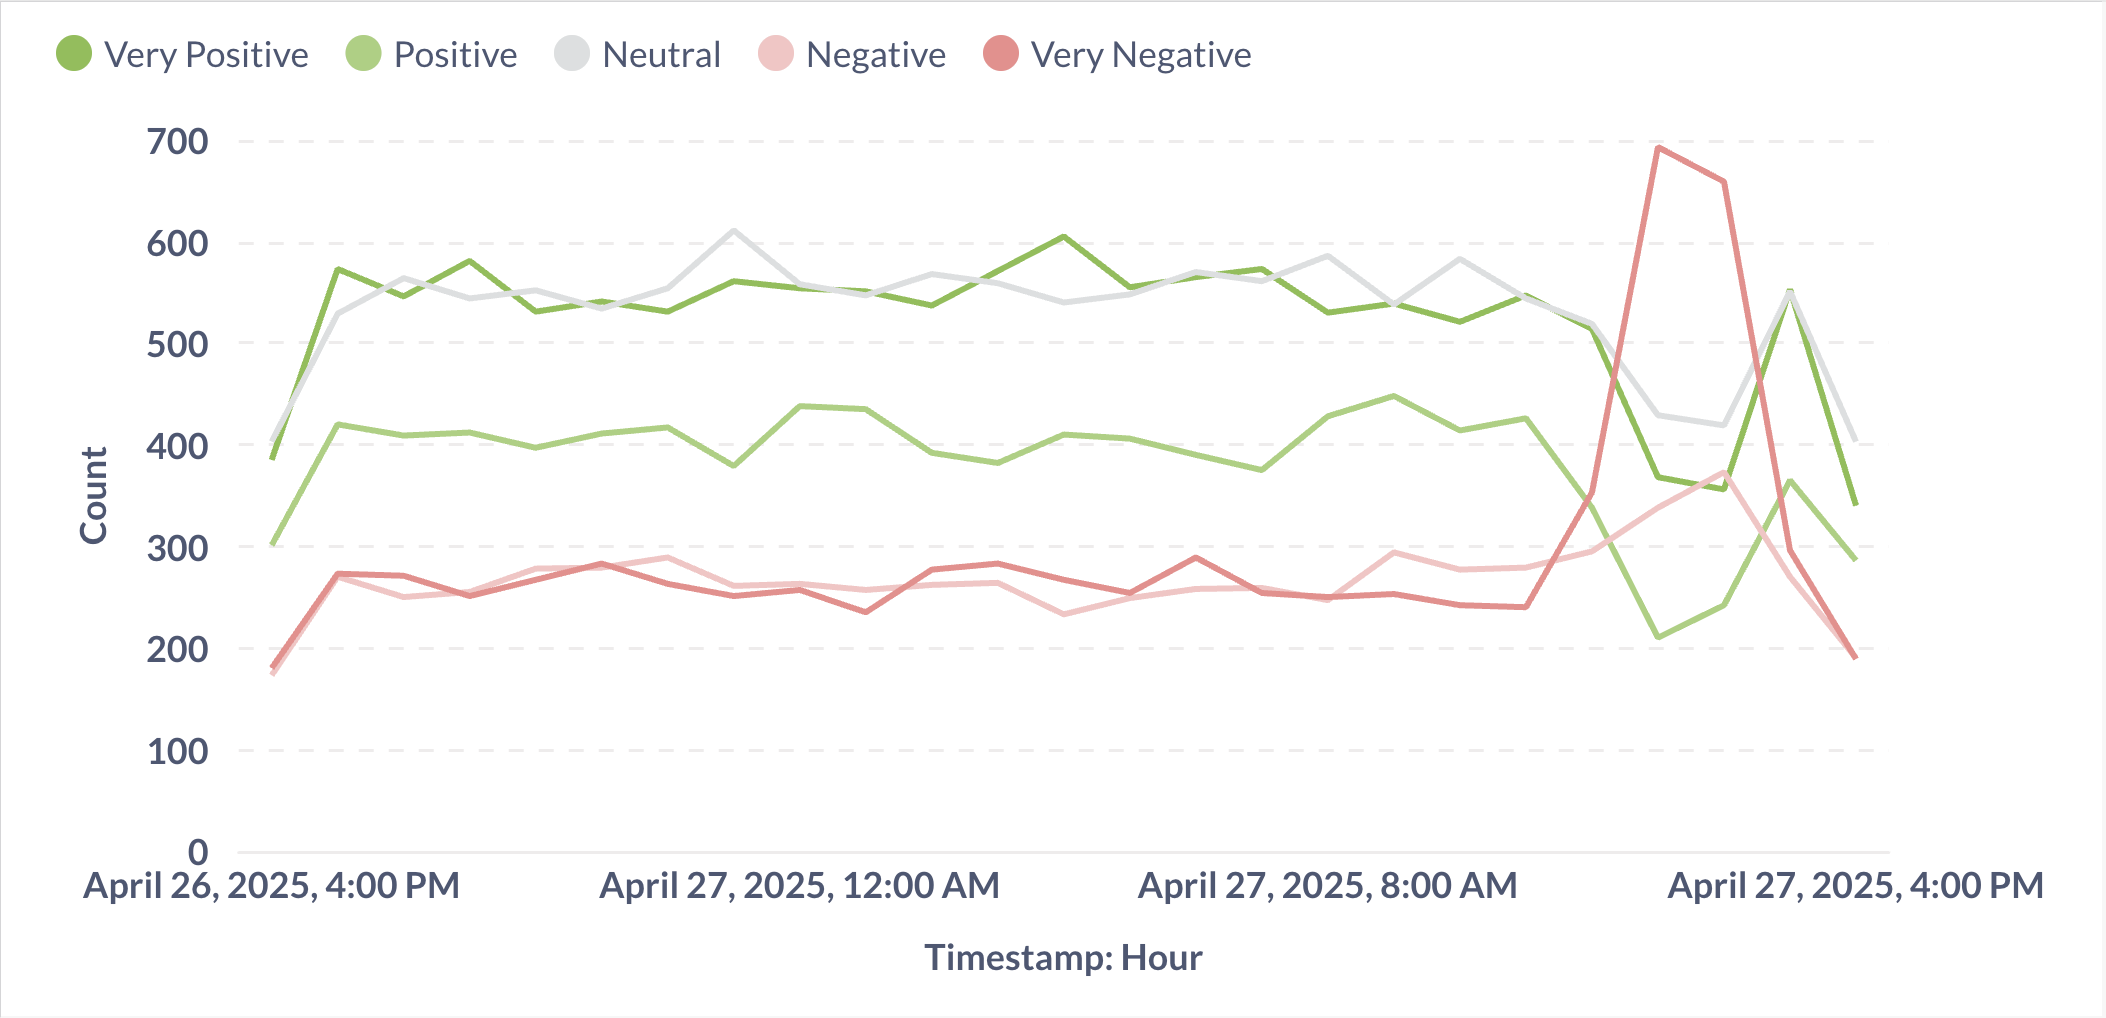
Figure 2: Time series showing sentiment trends over time. Peaks in positive sentiment correlate with product launches and promotional events.
This visualization shows the count of comments in each sentiment category.
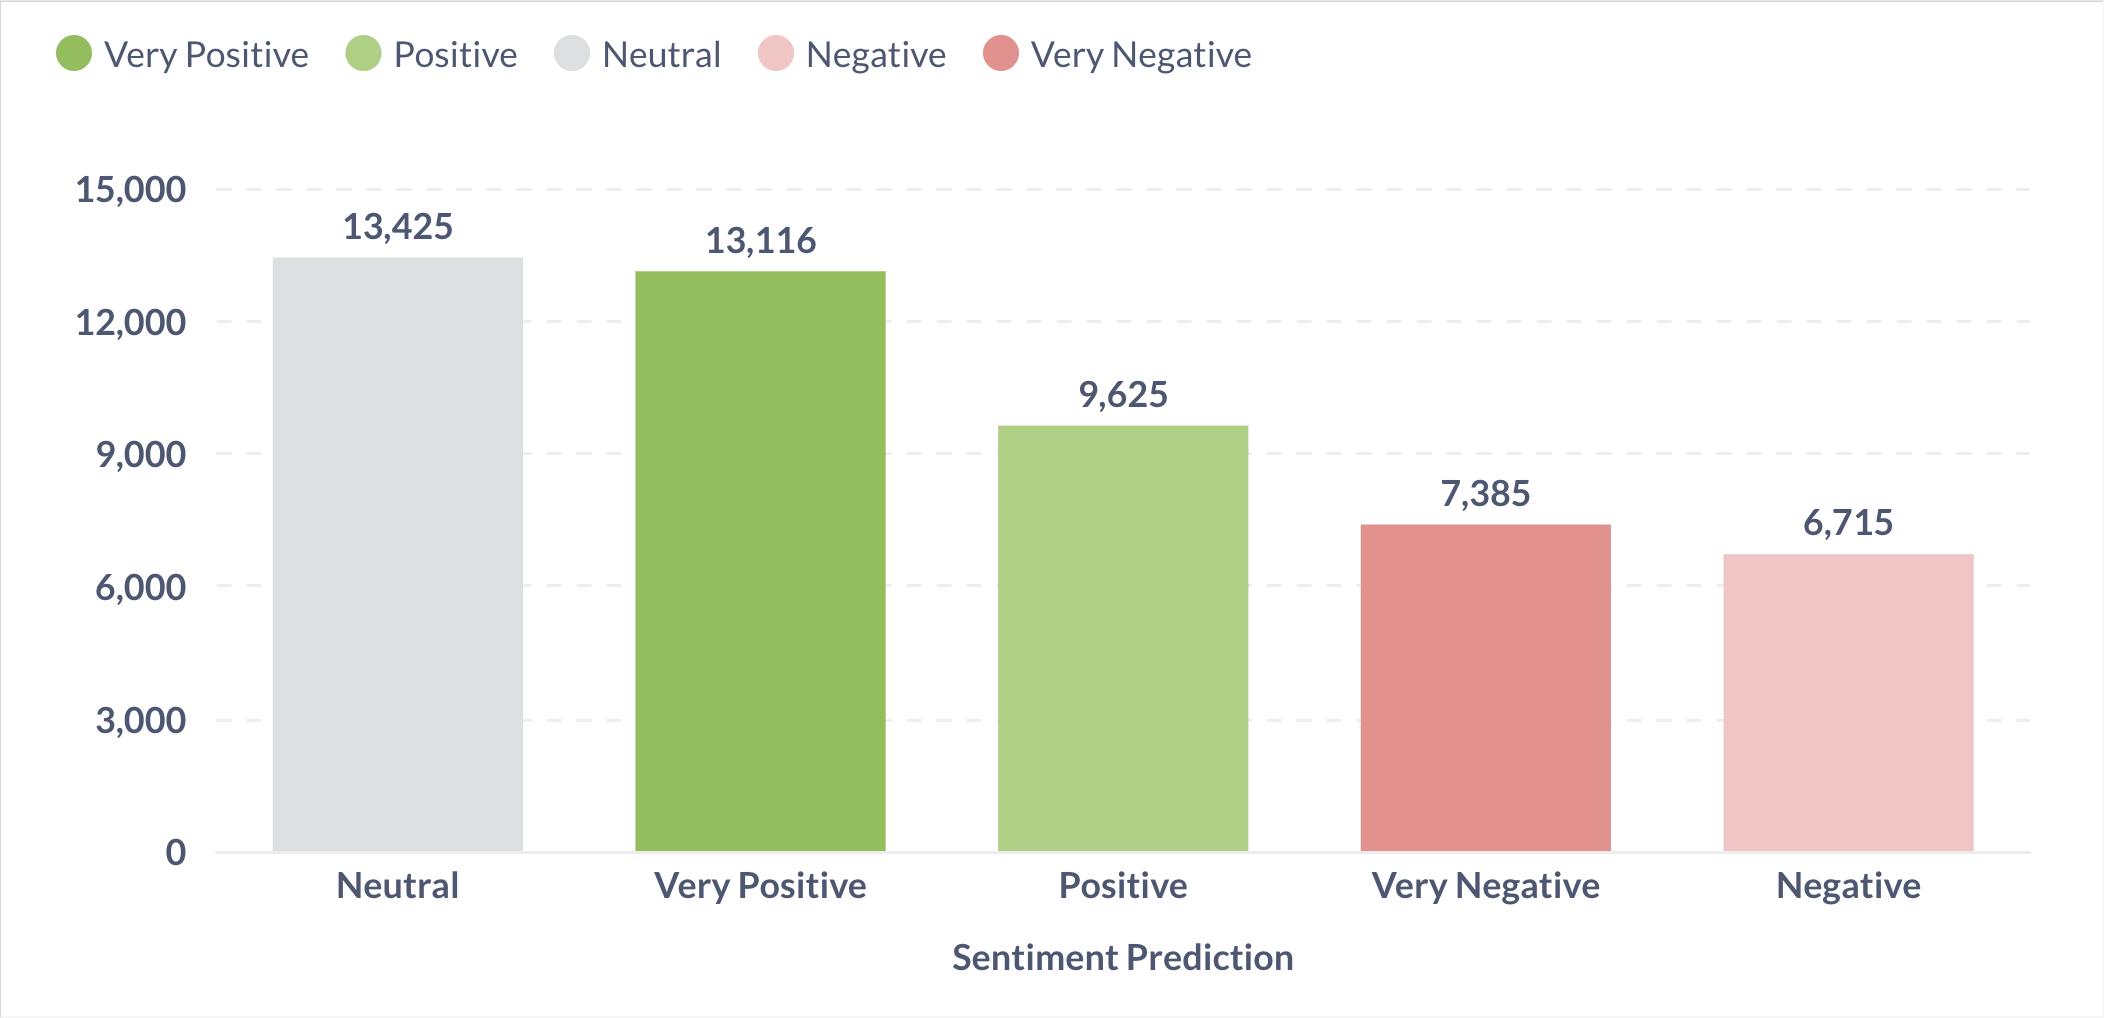
Figure 3: Bar chart showing the distribution of sentiment categories. This sample shows a healthy distribution across the five sentiment levels from Very Negative to Very Positive.
This visualization shows the proportion of each sentiment category as a percentage.
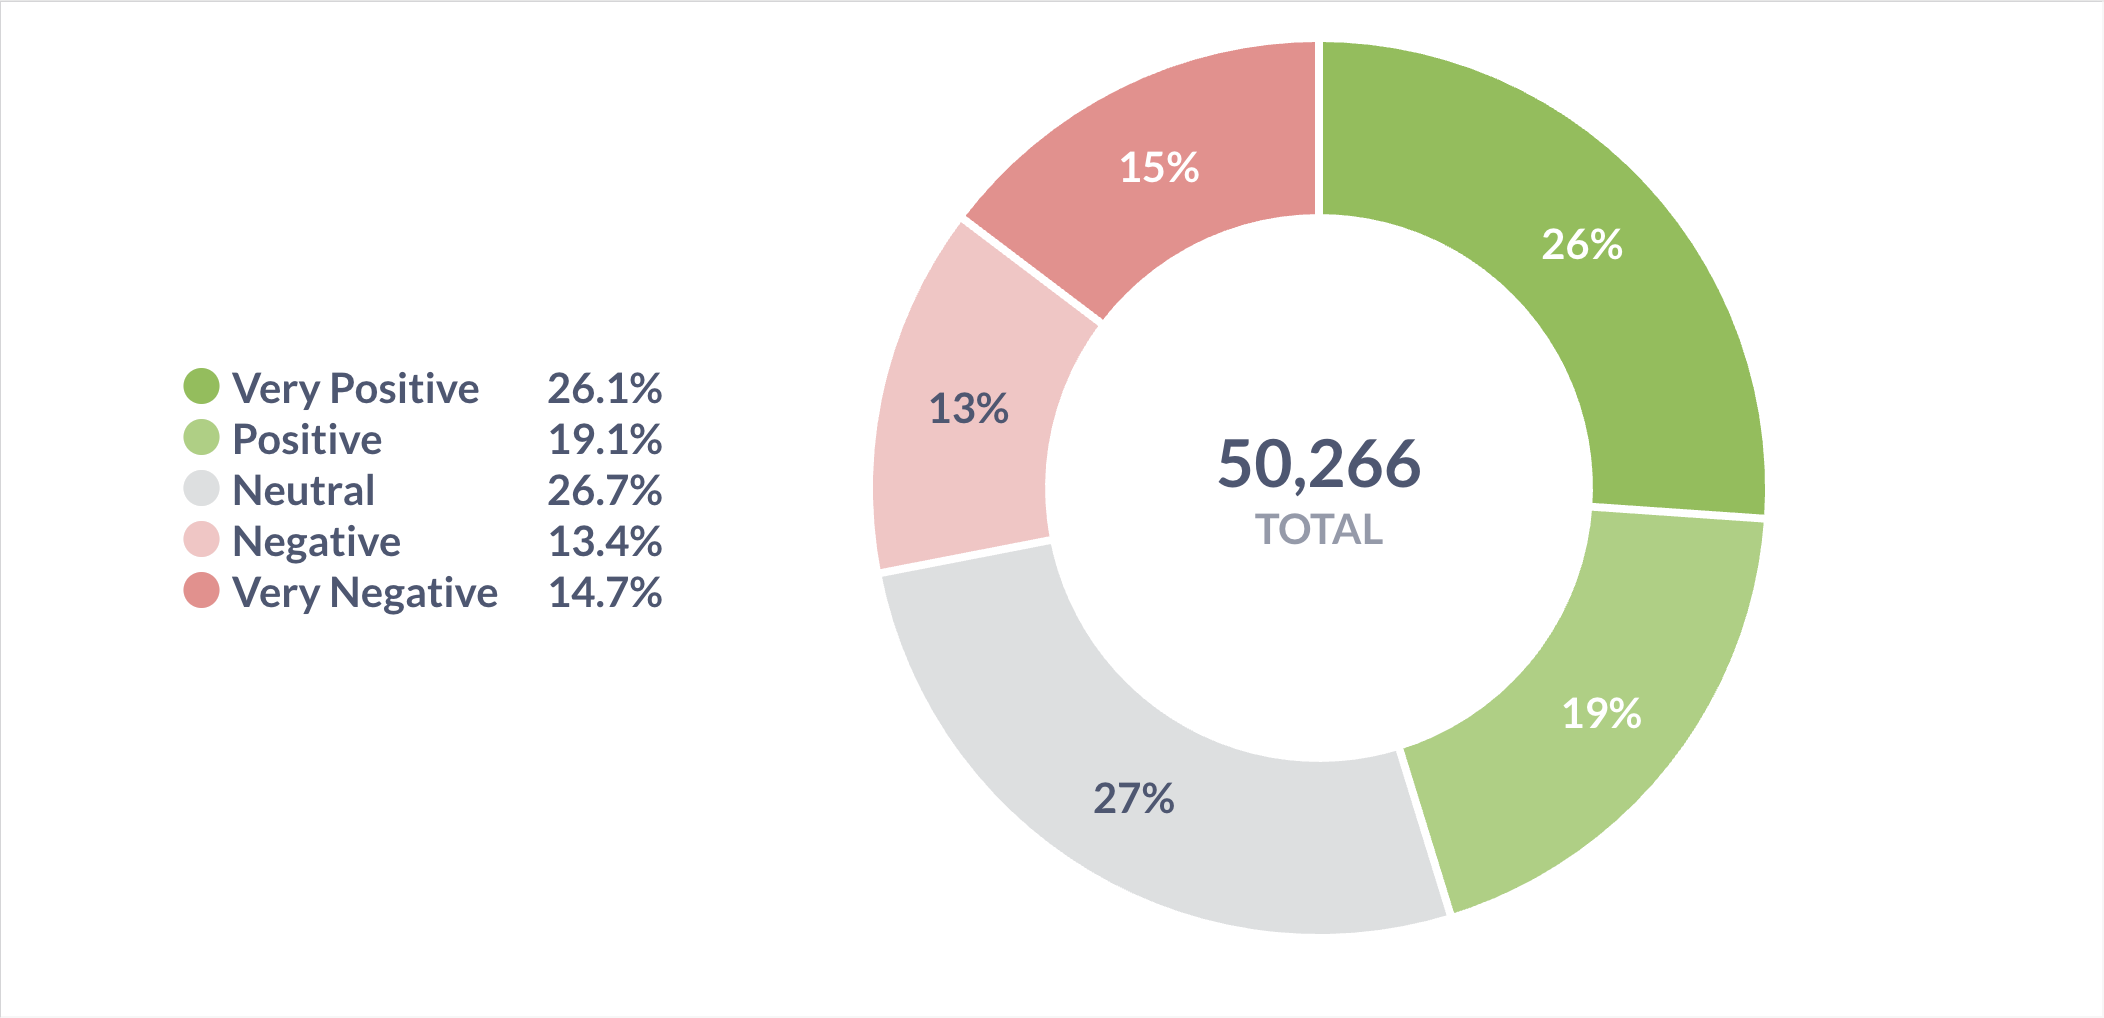
Figure 4: Pie chart showing the percentage distribution of the five sentiment categories (Very Negative, Negative, Neutral, Positive, Very Positive), providing a quick overview of overall customer sentiment.
# Stop the Python processes with Ctrl+C
# Stop the Docker containers
docker-compose down
If the producer or consumer can't connect to Kafka:
# Check if Kafka is running
docker-compose ps kafka

# Check Kafka logs
docker-compose logs kafka

# Ensure the topic exists
docker exec kafka kafka-topics --bootstrap-server localhost:9092 --list
If there are problems connecting to HBase:
# Check HBase status
docker-compose ps hbase

# Check HBase logs
docker-compose logs hbase

# Verify Thrift service is running
docker exec hbase jps
If there are problems connecting to MySQL:
# Check MySQL status
docker-compose ps mysql

# Test connection
docker exec -it mysql mysql -u user -ppassword -e "SELECT 1"
If services are crashing due to memory constraints:
