Abstract
Stock Report Generator is a sophisticated, production-ready multi-agent AI system that autonomously generates comprehensive equity research reports for stocks listed on the National Stock Exchange (NSE) of India. Built using LangGraph orchestration and LangChain tool integration, the system employs ** specialized autonomous agents** and integrated tools that collaborate through iterative reasoning and structured workflows to analyze stocks from multiple dimensions.
In this paper, we will cover why it is production ready?
Introduction
Stock Report Generator is a tool which uses AI Agents and tools to generate the stock report for stock symbol of NSE. It is covered in details in this article. Please refer for the details of the tool in this tool.
In this article, we will cover production readiness of this tool.
Production Readiness Checklists
Testing
- ✅ Unit-testing
- ✅ Integration testing
Guardrails
- ✅ Guardrails
Deployment and packaging
- ✅ FastAPI Server
- ✅ UI
Monitoring
- ✅ Logging activity
- ✅ Logging prompt
- ✅ Metrics collection
Documentation
- ✅ Deployment Documentation
- ✅ Project Documentation
- ✅ Policy Documentation
Testing
Apart from manually testing this project, this project has unit tests and integration tests.
-
✅ Unit-testing
Comprehensive unit tests written using pytest framework covering all major components including tools, utilities, and helper functions. Test files are located in
tests/unit/directory with tests for guardrails, circuit breaker, metrics, session manager, and various tool components.How to run unit tests:
- Install pytest and pytest-cov if not already installed:
pip install pytest pytest-cov - Run all unit tests:
pytest tests/unit/ - Run specific test file:
pytest tests/unit/test_<module_name>.py - Run with verbose output:
pytest tests/unit/ -v - Run with coverage report:
pytest tests/unit/ --cov=src --cov-report=html
- Install pytest and pytest-cov if not already installed:
-
✅ Integration testing
End-to-end integration tests implemented using pytest for full workflow testing of both AI mode and structured mode. Integration tests are located in
tests/integration/directory and validate complete report generation workflows, error handling, and edge cases.How to run integration tests:
- Run all integration tests:
pytest tests/integration/ - Run with verbose output:
pytest tests/integration/ -v - Run all tests (unit + integration):
pytest tests/
- Run all integration tests:
Gaurdrails
Comprehensive LLM guardrails system implemented using Guardrails AI library with extensive custom validation. The guardrails system provides multi-layered protection for all LLM API calls through the LLMGuardrailsWrapper class which automatically validates inputs and outputs before and after LLM interactions.
Input Validation: The system performs input validation including prompt injection detection using pattern matching against common injection techniques such as "ignore previous instructions", "forget your prompts", role-playing attempts, and system message overrides. Input length validation ensures prompts stay within acceptable limits, and harmful content detection filters out financial domain-specific harmful keywords like "financial fraud", "market manipulation", "insider trading", and "pump and dump" schemes.
Output Validation: All LLM responses are validated for safety, compliance, and format correctness. The system checks for toxic language, PII (Personally Identifiable Information) detection, secret detection, and ensures outputs match expected formats (JSON, markdown, etc.). Financial domain-specific validation patterns ensure stock symbols, percentages, and financial metrics conform to expected formats.
Integration: The guardrails wrapper is seamlessly integrated into the LLM call wrapper (llm_guardrails_wrapper.py) which automatically applies validation to all chat_completion and async_chat_completion calls. The system includes graceful fallback mechanisms - if Guardrails AI library is not available, the system continues with custom validation patterns, ensuring the application remains functional while maintaining security.
Guardrails AI Features: When available, the system leverages Guardrails AI hub validators including DetectPII, DetectSecrets, ToxicLanguage, BanSubstrings, BanTopics, ReadingTime, and PolitenessCheck. All guardrail checks are logged with detailed results including passed checks, warnings, and failed validations, providing full audit trails for security compliance.
Deployment and packaging
FastAPI Server
FastAPI-based REST API server implemented in src/api.py with production-ready features including CORS middleware, rate limiting using slowapi, and health check endpoints. The server supports both AI mode and structured workflow modes through configurable request parameters. Docker deployment is fully supported with Dockerfile and docker-compose configuration, and the health check endpoint at /health provides comprehensive system status including circuit breaker state, generator initialization status, and metrics availability. The circuit breaker pattern is implemented for resilience, automatically protecting against cascading failures from external API dependencies.
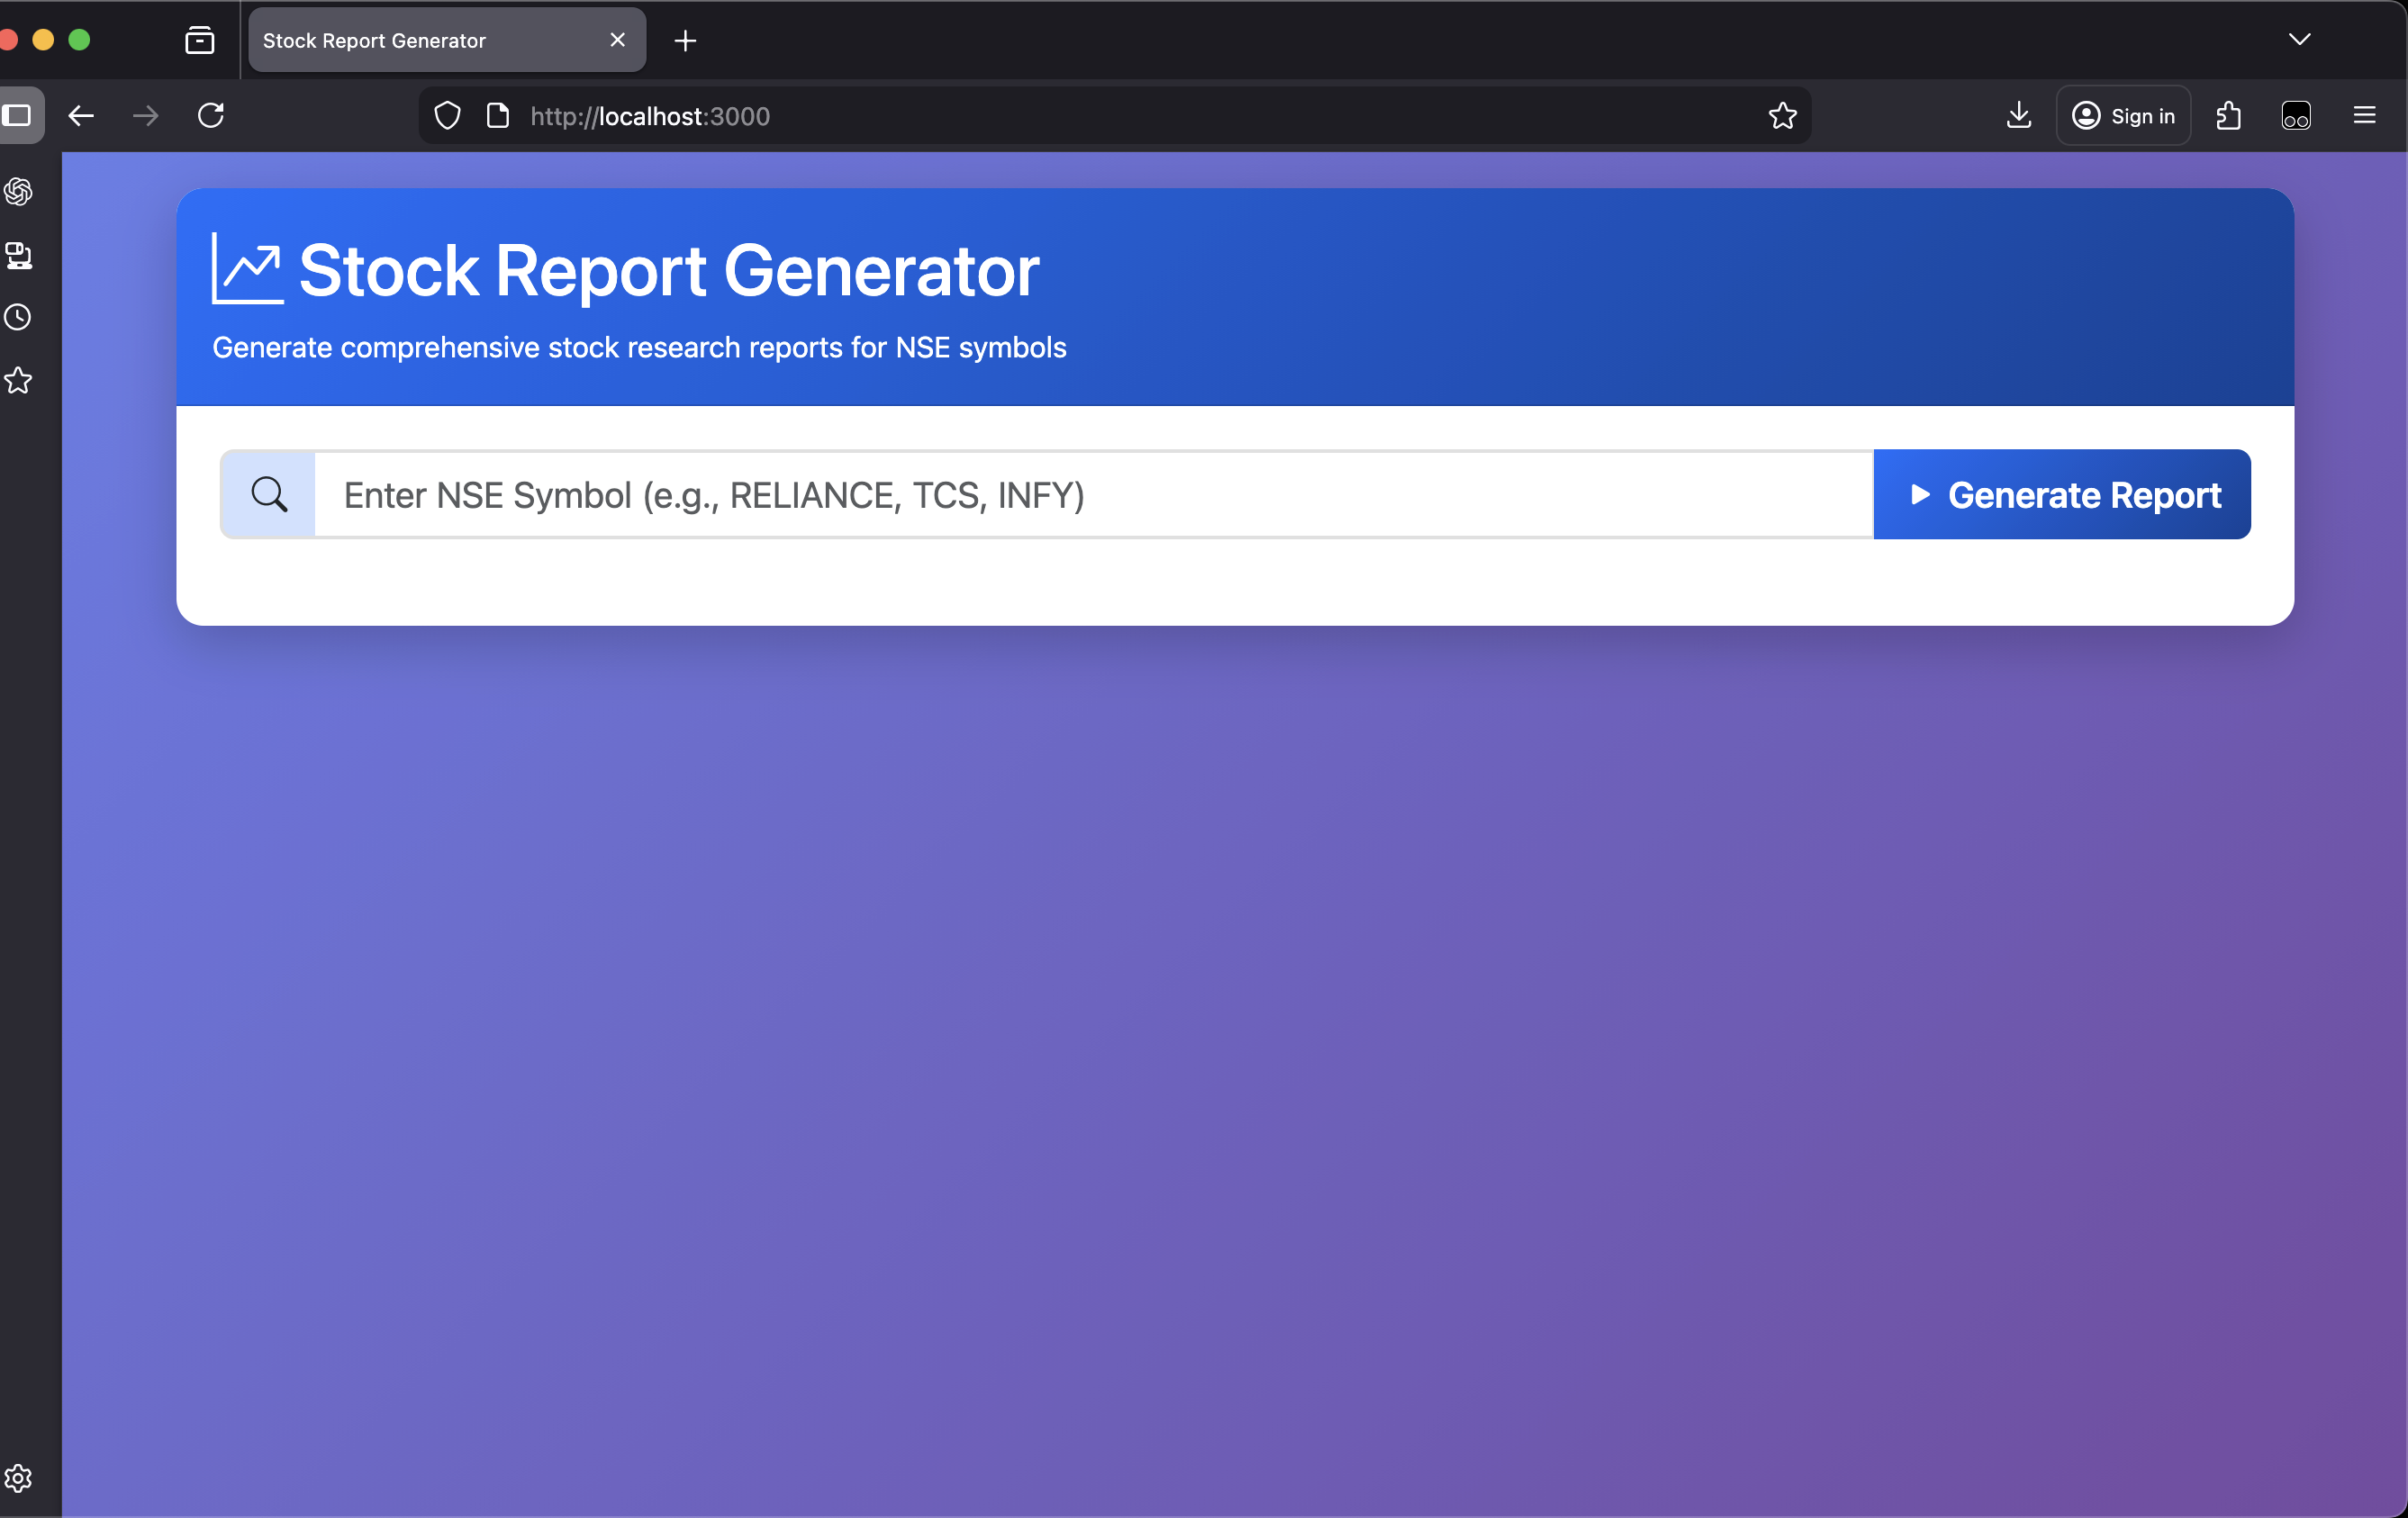
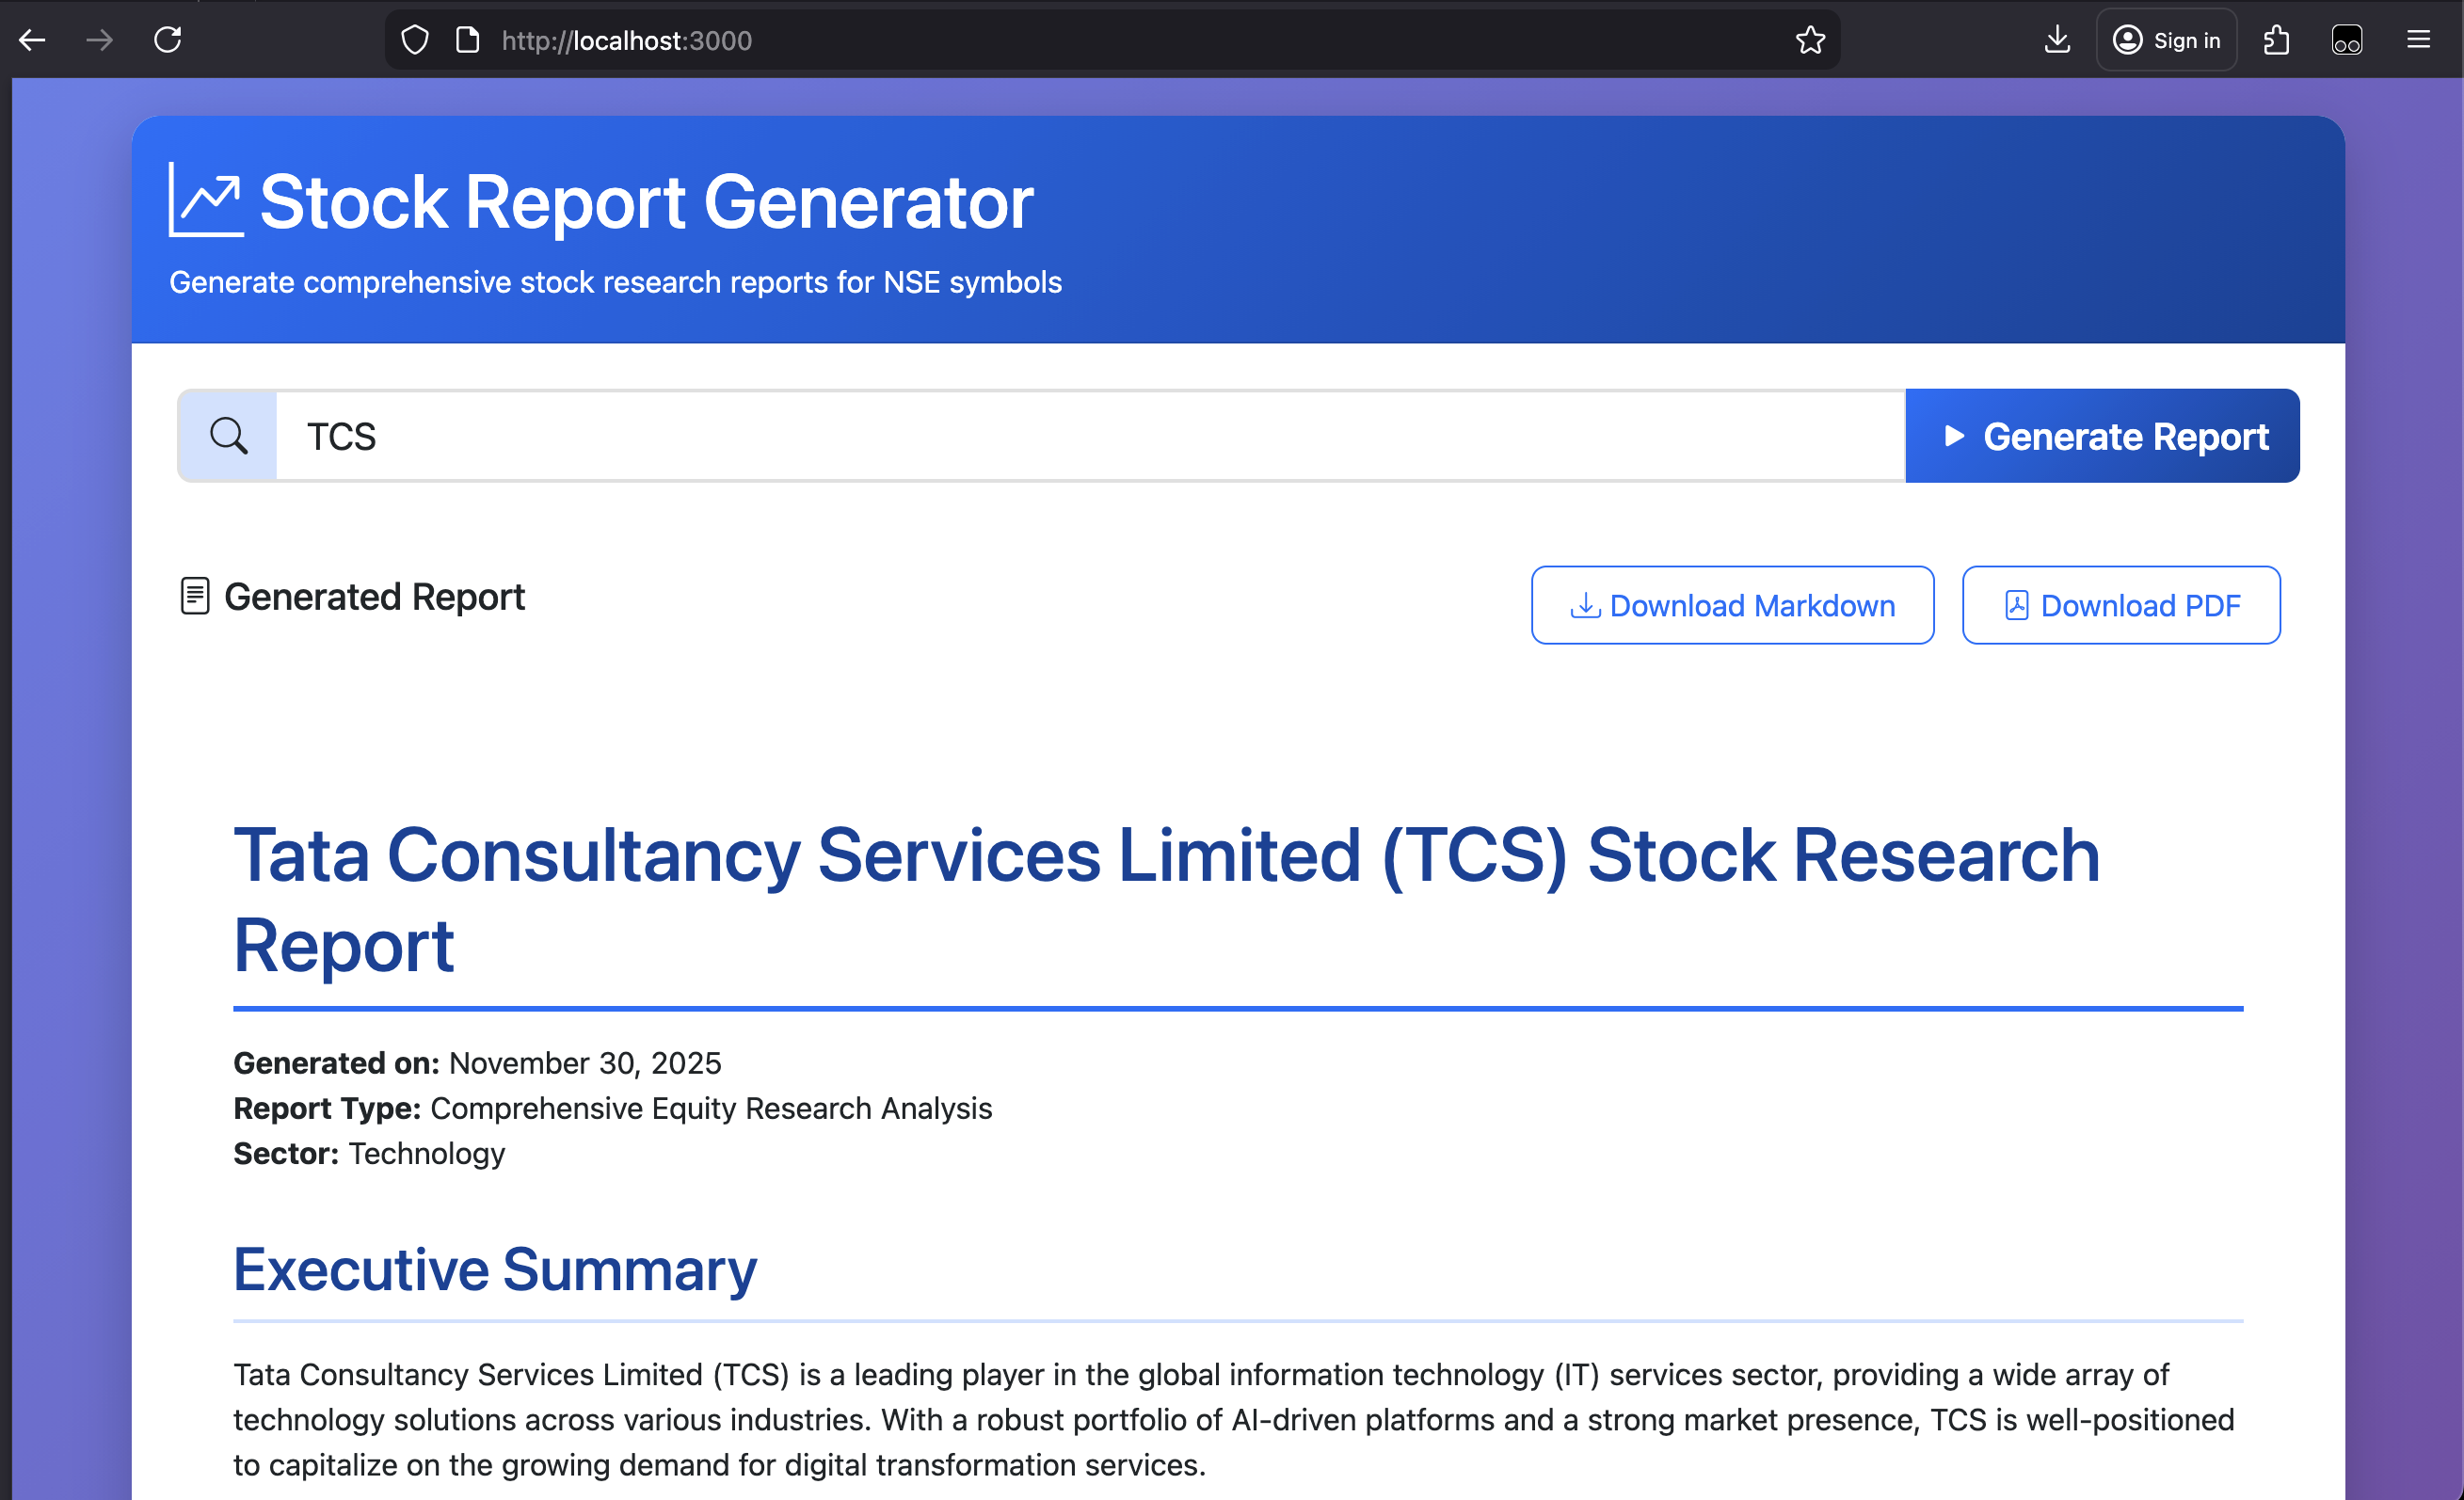
UI
Modern web-based UI implemented in ui/ directory as a static HTML/CSS/JavaScript application with no build process required. The UI connects to the FastAPI backend for report generation and includes features such as stock symbol input, real-time report generation, markdown rendering with syntax highlighting, and PDF download capabilities. The UI supports Docker deployment with Nginx container option and features responsive design for both mobile and desktop devices. Please note that this UI is not hosted in any public platform due to limited credits available in OpenAI. It can be run locally as per the instructions provided in deployment documentation.
Some of the screenshots are as follows:
Its video demo is hosted here
Monitoring
Logging activity
Comprehensive logging system implemented using Python logging module with structured logging and MDC (Mapped Diagnostic Context) support.
Each workflow execution is tracked with a unique session ID that is included in all log entries, along with stock symbol and agent name for contextual tracking.
Log files are stored in logs/ directory with rotation support, and the main application logs are written to logs/stock_report_generator.log with configurable log levels (DEBUG, INFO, WARNING, ERROR). The logging system provides full traceability of system operations, errors, and performance metrics.
Logging prompt
Separate prompt logging implemented in logs/prompts.log with all LLM prompts and responses logged with timestamps, session ID, stock symbol, agent name, and model information. The logging uses a simple, readable format for easy debugging and analysis, with clear separators and structured message formatting. The OpenAI logger utility tracks token usage, cost estimation, and performance metrics for each LLM call, providing comprehensive visibility into AI operations. A combined prompts and outputs logging option is available, allowing all LLM interactions to be captured in a single log file for complete audit trails.
Metrics Collection
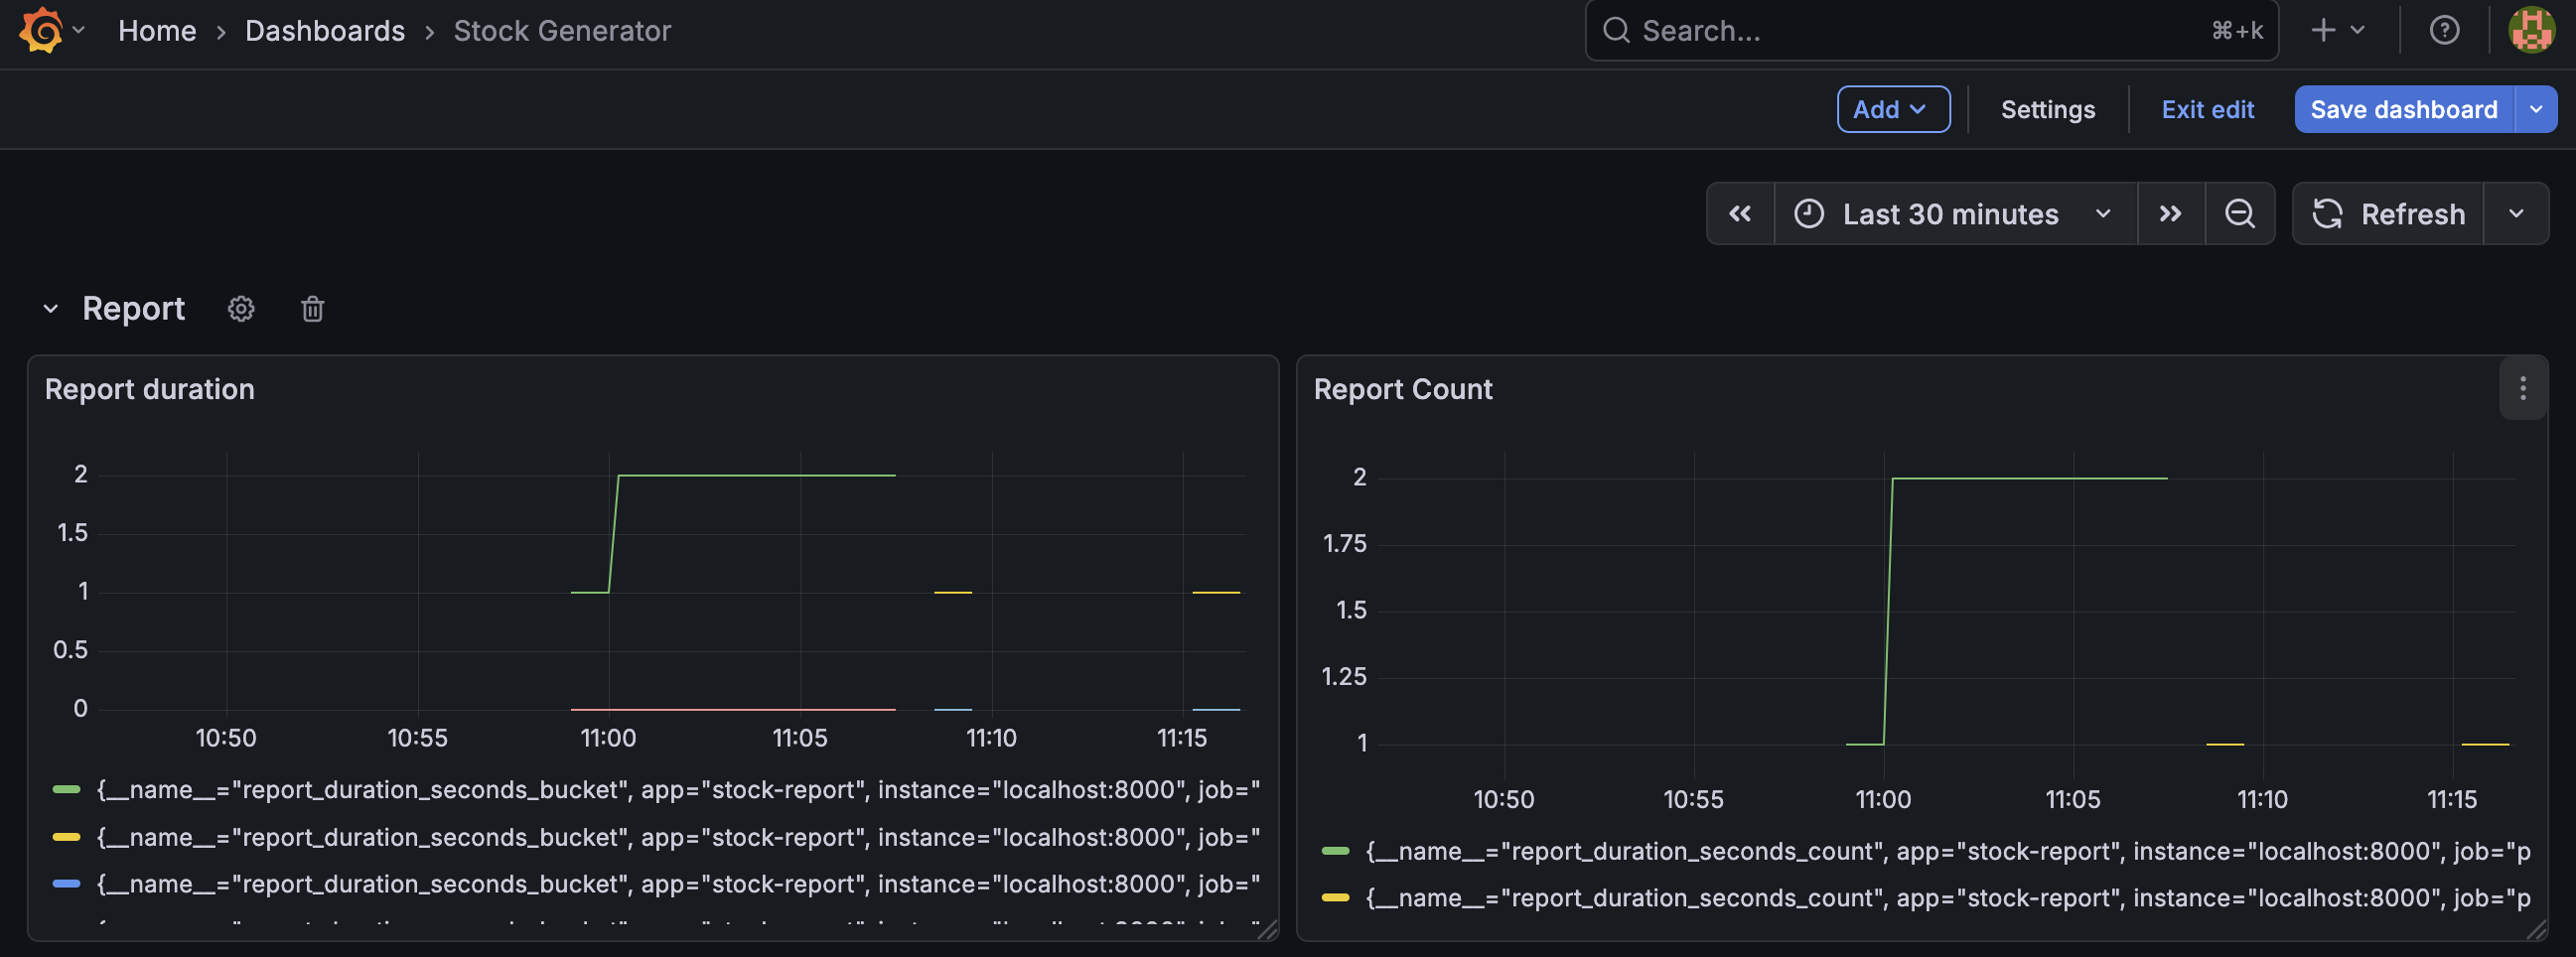
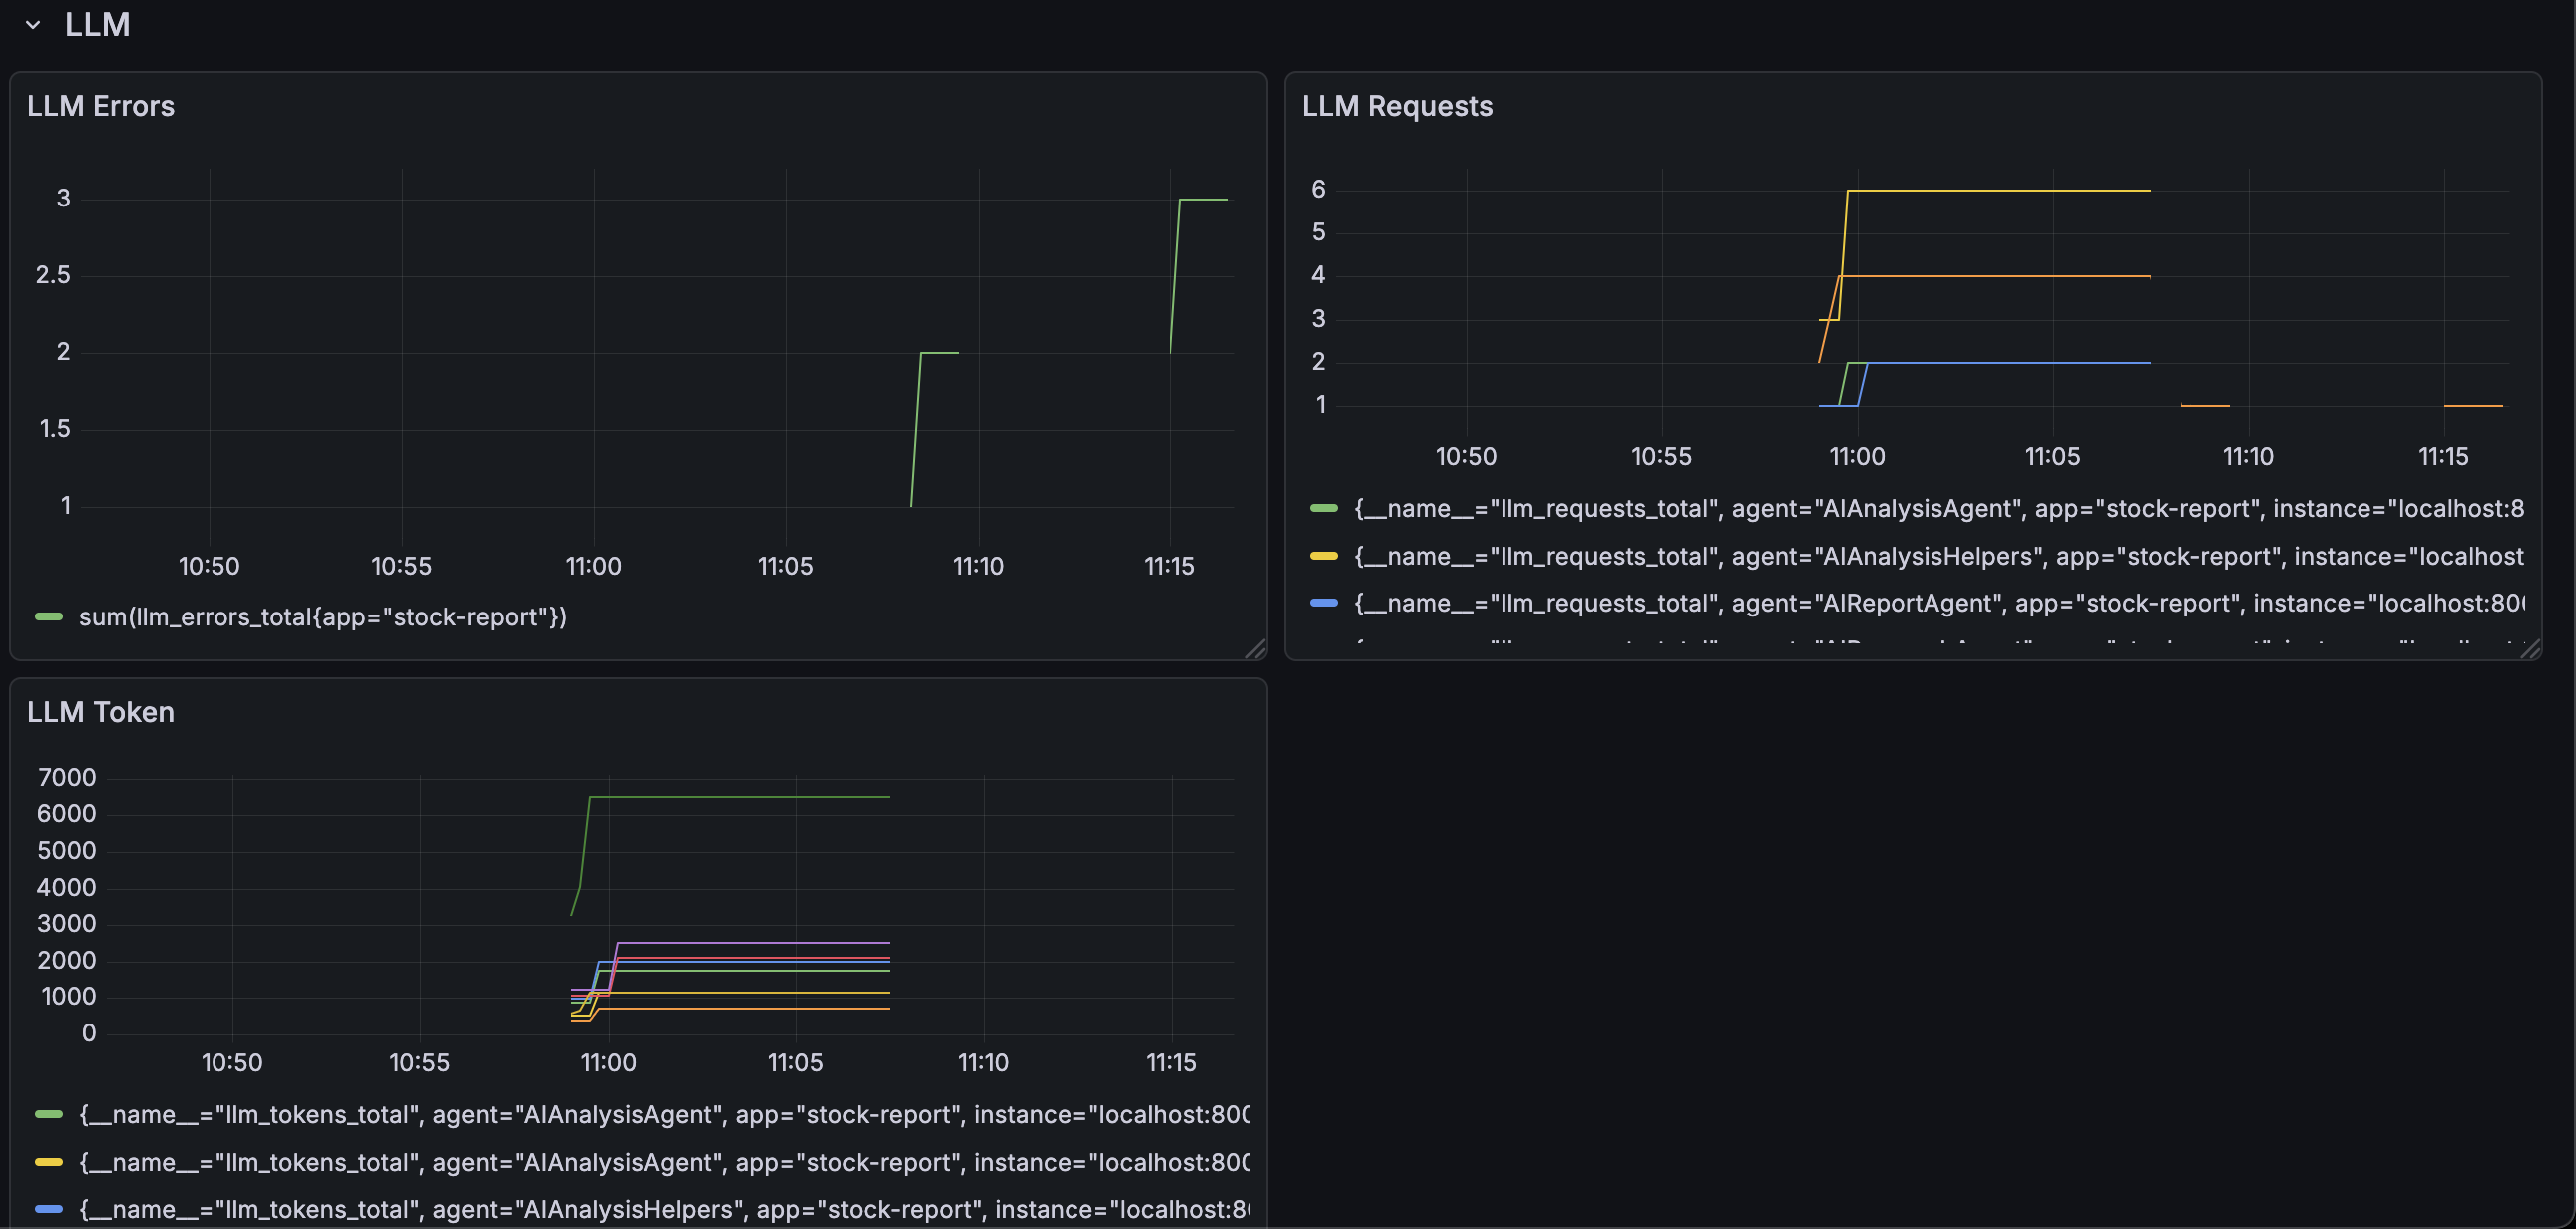
Comprehensive metrics collection system implemented in src/utils/metrics.py that provides dual-mode operation: always-on in-memory metrics collection with optional Prometheus export for production monitoring. The system tracks critical operational metrics including LLM request counts, errors, token usage (request and response tokens), and request durations with labels for model and agent identification. Report generation metrics track total reports generated, generation duration, and status (completed/failed) per stock symbol. Validation metrics record symbol validation attempts and outcomes, while error metrics track error types and locations throughout the system.
Prometheus Integration: When enabled via ENABLE_METRICS configuration, the system exports metrics in Prometheus format through a dedicated /metrics endpoint on the FastAPI server. The implementation supports multiprocessing mode for Uvicorn workers, automatically aggregating metrics from all worker processes using Prometheus multiprocess collector. Metrics are exposed with proper labels (model, agent, symbol, status, type, location) enabling rich querying and filtering in Prometheus and Grafana dashboards.
Available Metrics: The system exposes eight core metric types: llm_requests_total (counter with model/agent labels), llm_errors_total (counter with model/agent labels), llm_tokens_total (counter with model/agent/type labels), llm_duration_seconds (histogram with model/agent labels), reports_total (counter with symbol/status labels), report_duration_seconds (histogram with symbol label), validations_total (counter with symbol/status labels), and errors_total (counter with type/location labels). All metrics are automatically recorded throughout the application lifecycle via integration with LLM call wrappers, report generation workflows, and validation components.
Configuration: Metrics can be enabled/disabled via ENABLE_METRICS environment variable (default: false), with configurable metrics port via METRICS_PORT (default: 8080). The system gracefully handles scenarios where Prometheus client library is unavailable, falling back to in-memory metrics only. Comprehensive Prometheus setup documentation is available in docs/PROMETHEUS_SETUP.md with configuration examples, query examples, troubleshooting guides, and Grafana integration instructions. The metrics endpoint is accessible at /metrics and returns Prometheus-formatted text output suitable for scraping by Prometheus servers or monitoring tools.
Its metrics can be viewed in dashboards using grafana and alert can be setup.
Dashboard from the metrics are shown below:
Resilience
Retryable
Comprehensive retry mechanism implemented with exponential backoff for handling transient failures in API calls and tool invocations. The retry system provides specialized decorators for different use cases including retry_llm_call() for OpenAI API calls, retry_tool_call() for tool invocations, and async_retry_llm_call() for asynchronous operations. The retry mechanism automatically handles retryable exceptions such as APIError, RateLimitError, APIConnectionError, APITimeoutError, and general connection errors. Configurable parameters include maximum retry attempts, initial delay, maximum delay, and exponential base for backoff calculation. The system distinguishes between OpenAI-specific retryable exceptions and general API retryable exceptions, ensuring appropriate retry strategies for different failure types. All retry attempts are logged with detailed information including attempt numbers, failure reasons, and retry delays, providing full visibility into resilience operations.
Circuit-breaker
Circuit breaker pattern implemented for API failure handling with three-state operation (CLOSED, OPEN, HALF_OPEN) to prevent cascading failures and protect downstream services. The circuit breaker tracks failures in a sliding time window and automatically opens the circuit after a configurable threshold of failures is reached within the time window. When the circuit is open, requests are immediately rejected without attempting the operation, preventing resource exhaustion and allowing the service to recover. The system includes automatic recovery mechanisms that transition the circuit to HALF_OPEN state after a recovery timeout period, allowing test requests to verify service recovery. Successful operations during HALF_OPEN state close the circuit and resume normal operation, while failures during HALF_OPEN immediately reopen the circuit. The circuit breaker is thread-safe with proper locking mechanisms and is integrated into the FastAPI server endpoints, providing system-wide protection. Configuration parameters include failure threshold (default: 3 failures), time window (default: 120 seconds), and recovery timeout (default: 60 seconds), all configurable through environment variables. The circuit breaker state is exposed through the health check endpoint, allowing monitoring and observability of system resilience status.
Documentation
Documentation is boring yet important part of the project. This project has documentation in the repo itself.
Deployment Documentation
Comprehensive deployment guide available in docs/DEPLOYMENT.md covering Docker deployment, Docker Compose, manual deployment, and cloud platform deployment options including AWS, GCP, and Azure. The documentation includes detailed instructions for API server deployment, UI deployment, production considerations and troubleshooting guides. Scaling considerations and security best practices are thoroughly documented, providing production-ready deployment guidance.
Project Documentation
Main README.md provides quick start guide, architecture overview, and usage examples. Comprehensive system documentation is available in docs/DOCUMENTATION.md with detailed methodology, installation instructions, fine-tuning parameters, and results. Agent specialization documentation in docs/AGENT_SPECIALIZATION.md provides detailed information on each agent's roles and responsibilities. Implementation summary and developer handoff guides are available, along with API documentation and code examples for programmatic usage.
Policy Documentation
Data policy documentation in docs/DATA_POLICY.md provides comprehensive coverage of data collection, usage, storage, and security practices. User rights and compliance information are documented, including GDPR considerations and data deletion procedures. Code of conduct is available in docs/CODE_OF_CONDUCT.md, and clear policies on data handling, third-party services, and user privacy ensure transparency and compliance with data protection regulations.
Conclusion
The Stock Report Generator system is production-ready across all essential enterprise criteria. It has reliability backed by extensive testing, including multiple unit tests and full integration tests that validate end-to-end workflows in both AI-driven and mixed modes.
Security and safety are enforced through multi-layer guardrails that prevent prompt-injection, validate outputs, and filter harmful content. Built-in fallback logic ensures uninterrupted operation even when external libraries fail. System resilience is ensured with robust retry mechanisms, exponential backoff, and a circuit-breaker design that protects against cascading failure.
Operational visibility is with structured and session-aware logging, dedicated prompt-logging for audits, and detailed metrics supporting both in-memory and Prometheus monitoring. Deployment is enterprise-grade through a FastAPI server with CORS, rate limiting, and health checks, and a container-friendly modern web UI.
Documentation covers deployment, architecture, agent design, and compliance-oriented policy guidelines. The modular architecture, strong error-handling, security controls, observability, and detailed documentation together ensure that the system is robust, secure, maintainable, and fit for production use in enterprise settings.