Production-Grade Agentic AI System 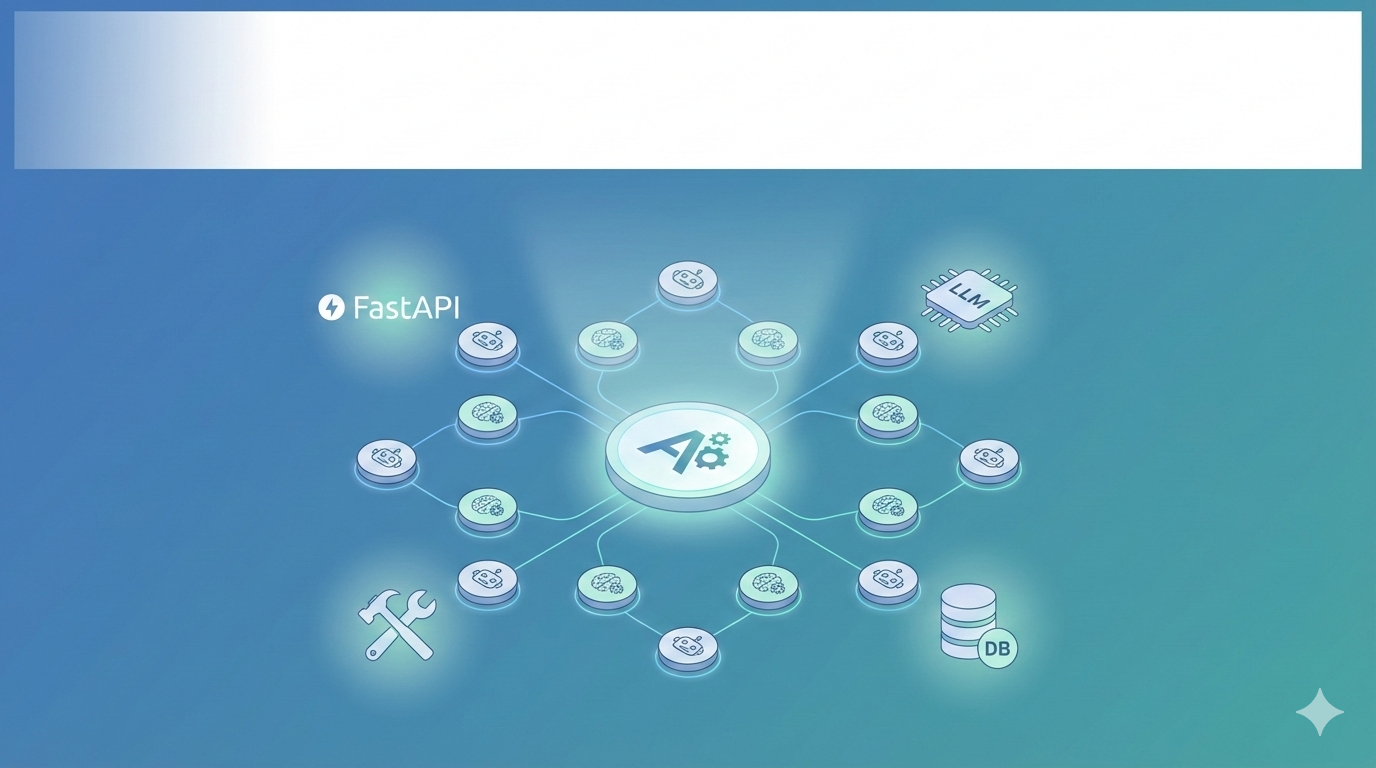
Production-Grade Agentic AI system — modular agent orchestration and tooling.
Explanation:
This hero image provides a high-level visual summary of the system: a central orchestrator that coordinates multiple agent nodes, connected to an LLM layer, small deterministic tools, and optional vector storage. Use this as the visual opener for the publication.
System Architecture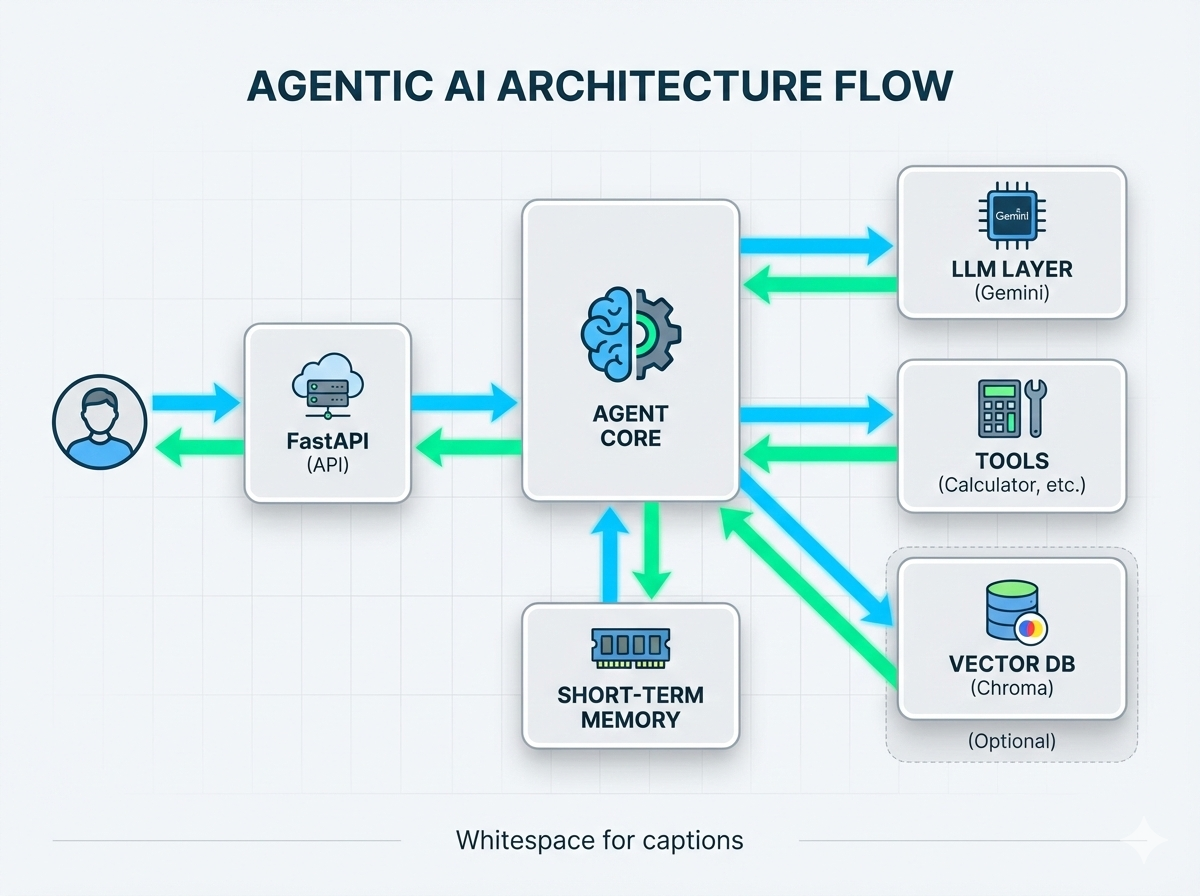
System architecture — FastAPI → Agent → LLM/Tools → Memory → Vector DB.
Explanation:
This architecture infographic maps the request flow and component responsibilities: the FastAPI HTTP layer receives user requests, the Agent Core orchestrates decisions (LLM vs tool), the LLM layer handles generative responses (Gemini when configured), deterministic tools handle bounded operations (calculator), memory stores short-term context, and an optional Vector DB (Chroma/FAISS) provides RAG capabilities. The arrows show direction of data flow and control.
Swagger UI Demo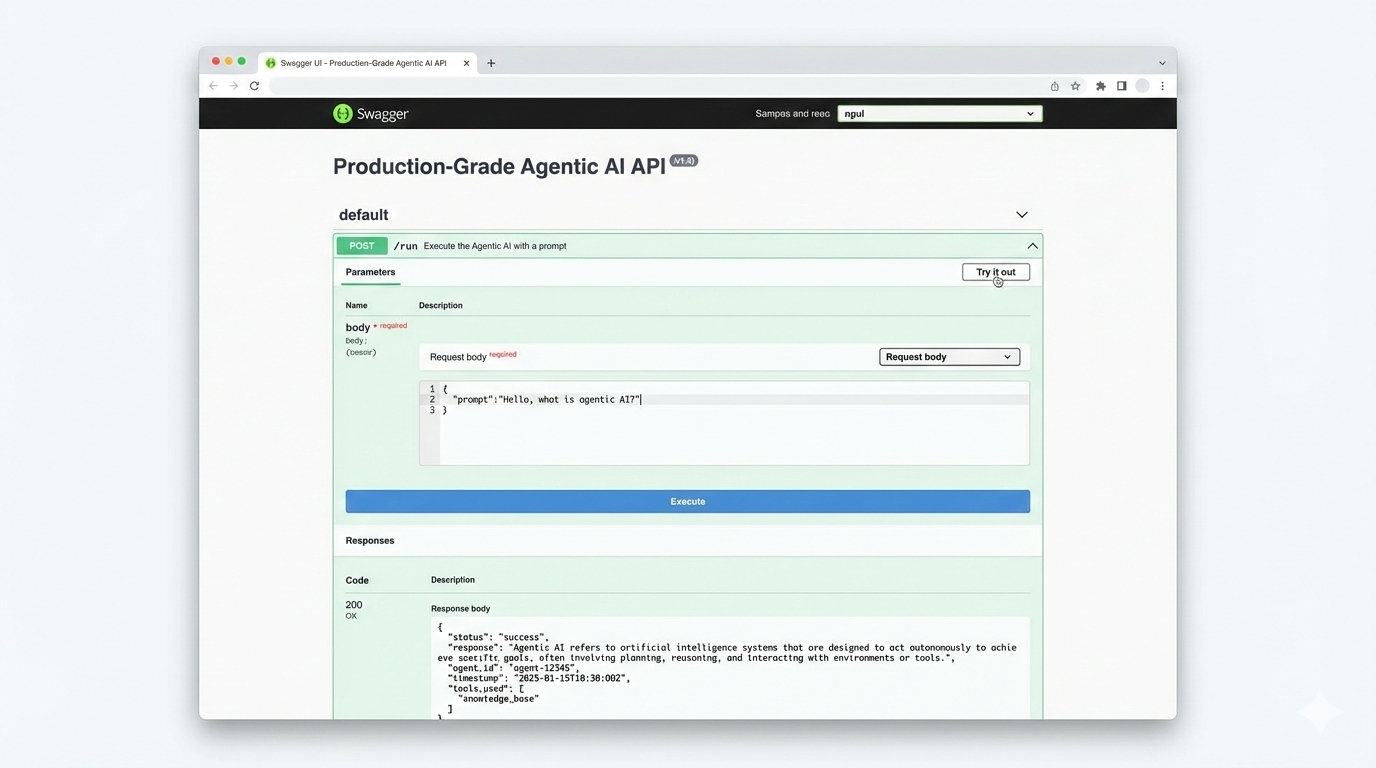
Swagger UI mock — POST /run endpoint with example request + response.
Explanation:
This mockup demonstrates how reviewers can interact with the system immediately via the automatically generated FastAPI docs (/docs). The screenshot shows the POST /run endpoint expanded with a JSON request and a sample JSON response. Use this image next to the Quickstart/API demo steps so reviewers can visually confirm the interaction pattern.
Agent Execution Flow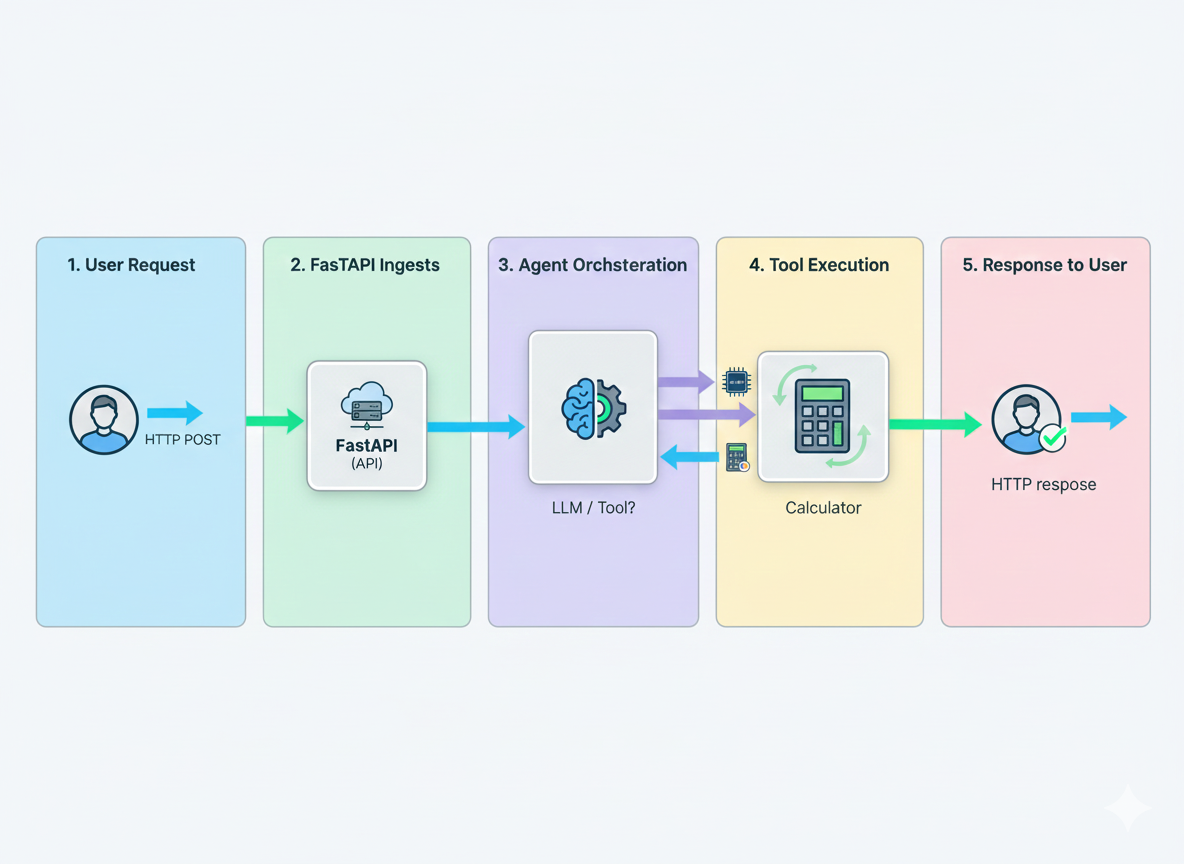
Agent execution storyboard — user request → FastAPI → agent decision (tool or LLM) → response.
Explanation:
This five-panel storyboard visualizes the sequence of events during an agent run: (1) user submits an HTTP request, (2) FastAPI receives and validates it, (3) Agent Core decides whether to call a tool or the LLM, (4) deterministic tools execute (e.g., calculator), (5) the final response is returned to the user. This clarifies where guardrails and input validation are enforced and where observability hooks are placed.
Observability Dashboard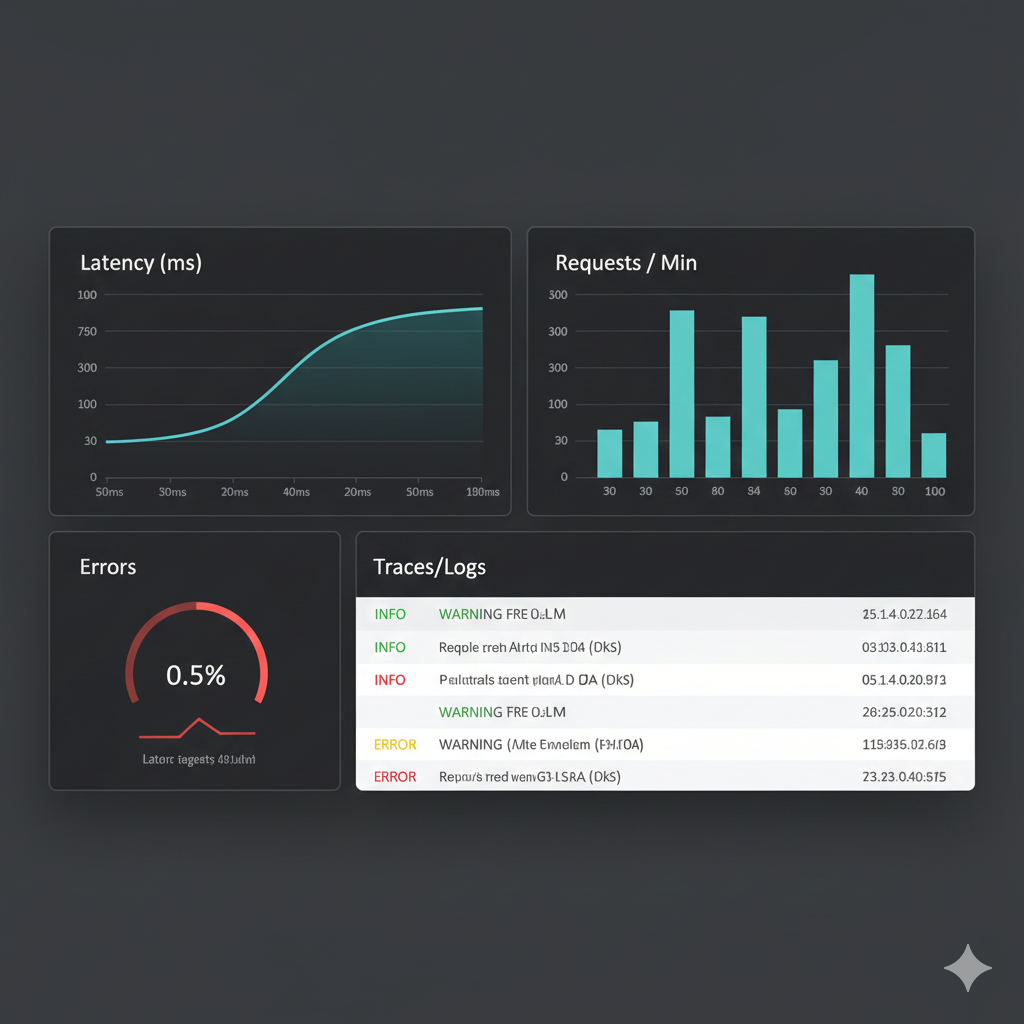
Observability mock — latency, throughput, error rate, and traces/logs panels.
Explanation:
This dashboard mockup illustrates the monitoring/observability surface you provide: latency time series, request throughput, an error-rate gauge, and a lightweight traces/logs panel (Console OTel exporter in the demo). The real project uses structured logging and OpenTelemetry console spans to surface operational data; swap the console exporter for an OTLP exporter in production if desired.
Terminal Demo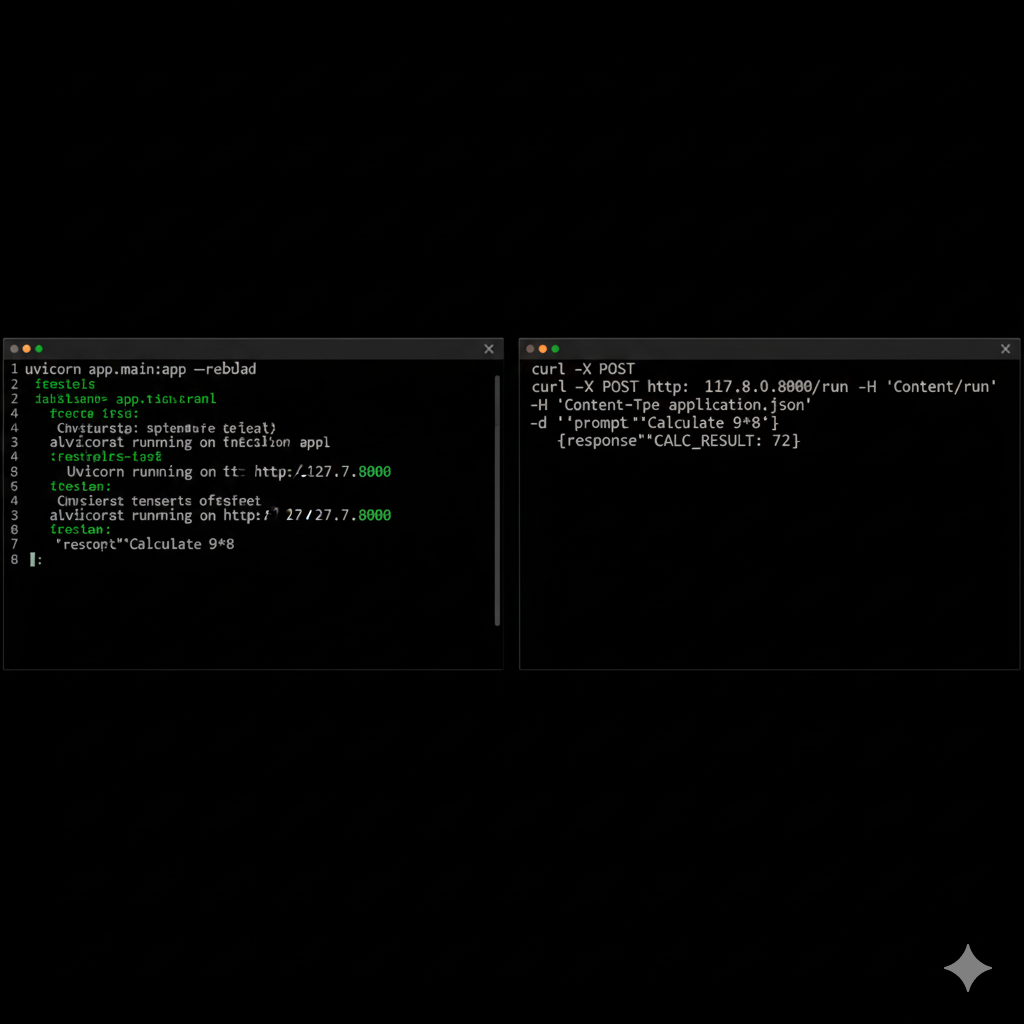
Terminal demo — uvicorn server running and curl returning JSON response (CALC_RESULT: 72).
Explanation:
This terminal mock shows the exact developer experience: starting the FastAPI server (uvicorn app.main:app --reload) and running a curl command to the /run endpoint returning a JSON response. The example demonstrates fallback tool behavior (CALC_RESULT: 72) when a calculation is requested.