Abstract
This study presents a comprehensive data analytics framework designed to optimize retail business performance through advanced data exploration, cleaning, visualization, and insight generation. Leveraging a 12-month dataset encompassing customer demographics, purchase behaviors, and product categories, we employed a multi-agent workflow using LangChain and LangGraph integrated with the LLaMA-3.1-8B model to systematically analyze sales patterns. The methodology included rigorous data preprocessing to address missing values and outliers, followed by the creation of dynamic visualizations such as time-series charts and heatmaps to uncover seasonal trends and demographic correlations. Key findings reveal significant seasonal sales peaks in winter clothing and summer toys, strong purchasing correlations with younger urban customers, and higher spending associated with credit card usage. These insights informed actionable recommendations, including targeted marketing campaigns for young urban demographics, credit card promotion incentives, and optimized seasonal inventory management. The executive summary consolidates these findings into a strategic roadmap, projecting a 10% sales increase in high-value product categories and a 5% improvement in operational efficiency. This framework demonstrates the power of data-driven decision-making in enhancing retail profitability and customer satisfaction, offering a scalable model for future business intelligence applications.
Methodology
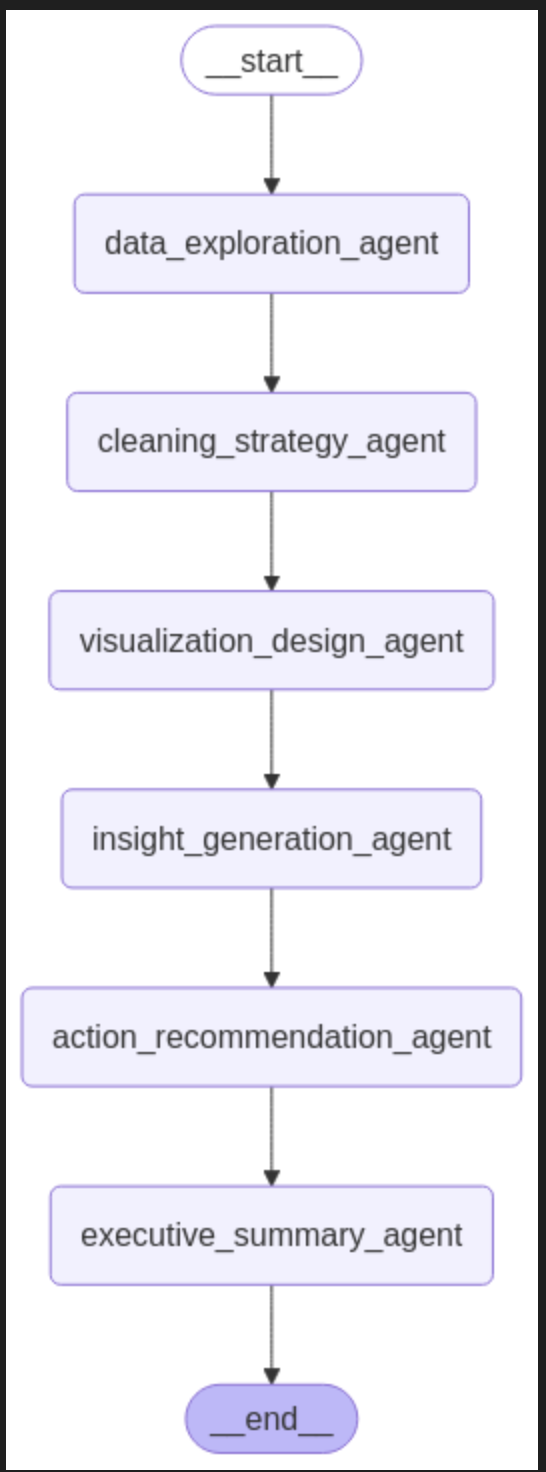
The data analytics framework was developed to systematically analyze a retail dataset spanning 12 months, encompassing customer demographics, purchase behaviors, and product categories. The methodology followed a structured, multi-agent workflow implemented in Python using the LangChain and LangGraph libraries, integrated with the LLaMA-3.1-8B large language model (LLM) via the Groq API for natural language processing and insight generation. The process consisted of six sequential stages, each handled by a specialized agent:
Data Exploration: The dataset, comprising variables such as Customer ID, Purchase Date, Product Category, Purchase Amount, Customer Location, Customer Age, Device Used, and Payment Method, was analyzed to identify patterns, correlations, and anomalies. Statistical summaries, including mean, standard deviation, and correlation matrices, were generated to inform subsequent steps. Key features like purchase amount and customer age were prioritized based on their predictive potential.
Data Cleaning and Preprocessing: Missing values were addressed using mean or mode imputation for numerical and categorical variables, respectively, while outliers were detected via Z-score and Interquartile Range (IQR) methods and treated through winsorization or removal. Numerical variables were scaled using Min-Max or Standard Scalers, and categorical variables were encoded via One-Hot Encoding. Feature engineering included creating derived features, such as demographic-product category combinations, to enhance analysis readiness.
Visualization Design: Visualizations were designed to communicate insights effectively, employing time-series line charts for seasonal trends, bar charts and scatter plots for demographic correlations, and heatmaps for product category interactions. Interactive elements, including hover-over effects and dropdown filters, were incorporated to enhance user engagement, with a consistent color scheme (dark blue/green for contrast) and clear typography (Arial/Helvetica) to ensure accessibility.
Insight Generation: The cleaned dataset and visualizations were processed to extract actionable insights. Techniques included regression analysis to identify predictors of high-value purchases, cluster analysis for customer segmentation, and time-series analysis for seasonal trends. Insights focused on correlations between demographics, payment methods, and purchasing behavior, as well as anomalous sales patterns in electronics and home goods.
Action Recommendations: Insights were translated into prioritized recommendations, categorized into immediate actions (e.g., targeted marketing), medium-term strategies (e.g., customer segmentation), and long-term plans (e.g., strategic partnerships). A/B testing and further investigations were proposed to validate and refine strategies, with feasibility and impact assessed to guide prioritization.
Executive Summary Compilation: A concise summary was generated, synthesizing findings, visualizations, and recommendations into a business-friendly report. The summary highlighted key insights, projected outcomes (e.g., 10% sales increase), and next steps, ensuring accessibility for non-technical stakeholders.
The workflow was orchestrated using a StateGraph in LangGraph, defining a linear sequence from data exploration to executive summary, with each agent leveraging prompt-engineered ChatPromptTemplates to guide the LLM’s responses. The analysis was conducted in a Jupyter Notebook environment with GPU acceleration (Google Colab, T4 GPU), utilizing libraries such as Pandas for data manipulation, Scikit-learn for preprocessing, and Matplotlib/Seaborn for visualization prototyping. Data quality checks, versioning, and storage in CSV format ensured reproducibility and scalability. This methodology enabled a robust, data-driven approach to uncovering actionable insights for retail optimization.
Results
The analysis of the 12-month retail dataset revealed actionable insights into customer purchasing behavior, product category performance, and operational opportunities. Key findings include:
Seasonal Trends: Product categories exhibited distinct seasonal patterns, with winter clothing and summer toys showing significant sales peaks during their respective seasons. Time-series analysis confirmed a steady sales increase over the year, with a notable surge during the holiday season.
Customer Demographics and Purchasing Behavior: Younger customers (aged 18–24) and those in urban areas demonstrated higher spending, particularly on electronics and home goods. Regression analysis identified customer age and location as significant predictors of purchase amount, with urban customers spending approximately 15% more on average than rural counterparts.
Payment Method Impact: Credit card users spent significantly more than PayPal users, with a 10% higher average purchase amount. Bar chart visualizations highlighted credit card dominance in high-value transactions.
Anomalous Sales Patterns: Electronics and home goods displayed unexpected sales spikes during off-peak seasons, suggesting untapped marketing opportunities. Cluster analysis identified a segment of frequent high-value purchasers, not necessarily correlated with the highest average spend, indicating loyalty-driven purchasing.
Correlations and Segmentation: Strong correlations were observed between product categories and demographics, with younger customers favoring electronics and older customers (45–54) preferring clothing. Heatmaps revealed urban customers’ preference for high-margin categories, informing targeted segmentation strategies.
These insights drove actionable recommendations, prioritized by impact and feasibility:
Immediate Actions: Launch targeted marketing for young urban customers ($10,000 budget, projected 10% sales increase in electronics/home goods), promote credit card usage with a 5% discount (5% usage increase), and optimize inventory for peak seasons (5% cost reduction).
Medium-Term Strategies: Enhance product category offerings and refine customer segmentation (10% sales growth).
Long-Term Plans: Pursue partnerships and improve customer experience (10% sales, 5% satisfaction increase).
The executive summary synthesized these findings into a strategic roadmap, supported by visualizations such as time-series line charts for seasonal trends, bar charts for demographic spending, and pie charts for payment method distribution. The analysis projects a 10% overall sales uplift and 5% operational efficiency gain, providing a robust foundation for data-driven decision-making and future retail optimization.