This project compares the predictive performance of ARIMA, LSTM, and Temporal Convolutional Network (TCN) models on the Dow Jones Industrial Average (DJIA). A multimodal dataset combining technical indicators, sentiment scores, and intent signals from news and Reddit was engineered to forecast closing prices across three future horizons: t+1, t+3, and t+7.
| Horizon | Train R² | Train RMSE | Test R² | Test RMSE |
|---|---|---|---|---|
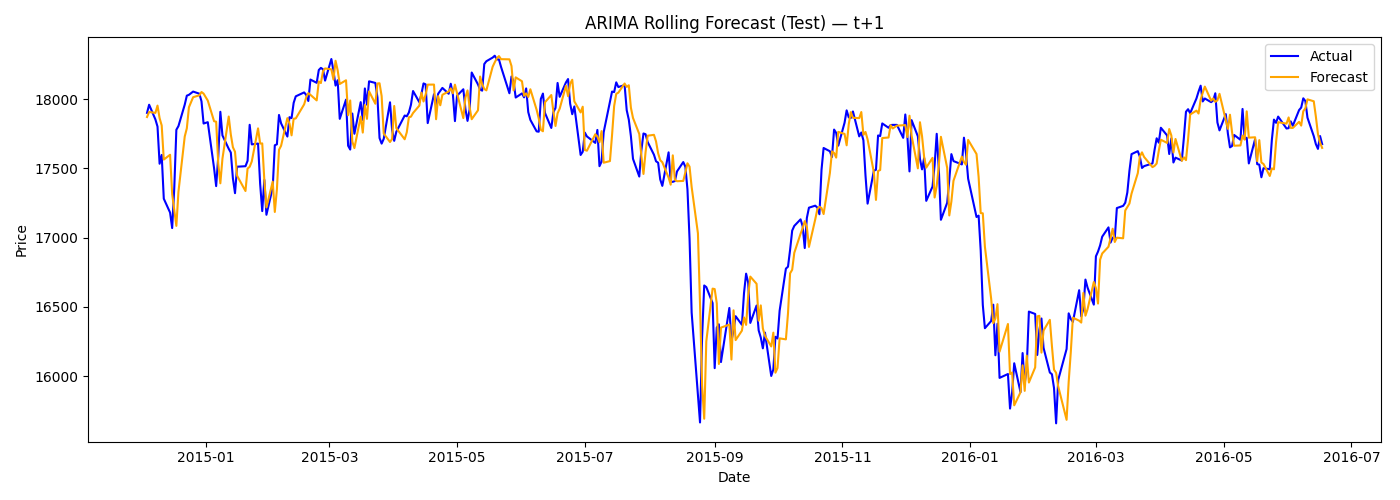
| t+1 | 0.9921 | 238.87 | 0.8655 | 228.79 |
| t+3 | 0.9877 | 297.54 | 0.7433 | 316.38 |
| t+7 | 0.9800 | 380.06 | 0.5662 | 413.11 |
ARIMA excelled in short-term forecasts but declined sharply for longer horizons due to lack of external signal integration.
| Horizon | Train R² | Train RMSE | Test R² | Test RMSE |
|---|---|---|---|---|
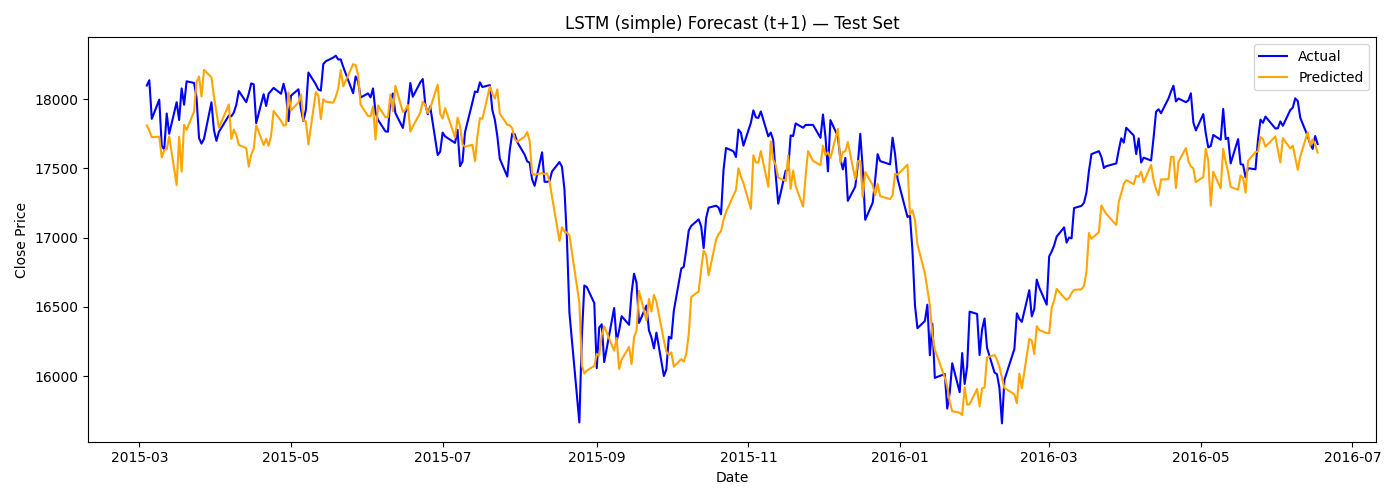
| t+1 | 0.9881 | 294.14 | 0.7606 | 319.58 |
| t+3 | 0.9863 | 315.44 | 0.2669 | 559.01 |
| t+7 | 0.9855 | 323.81 | 0.4156 | 501.07 |
Simple LSTM generalized well for t+1 but struggled beyond that, underfitting in volatile regimes.
| Horizon | Train R² | Train RMSE | Test R² | Test RMSE |
|---|---|---|---|---|
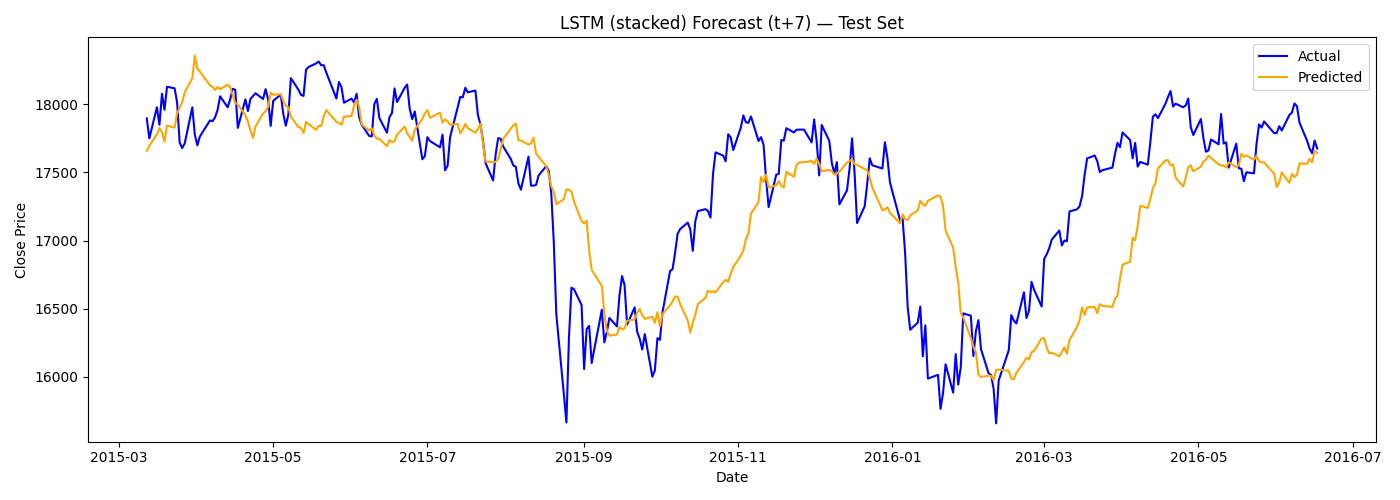
| t+1 | 0.9826 | 355.83 | 0.3267 | 535.94 |
| t+3 | 0.9858 | 320.75 | 0.3985 | 506.37 |
| t+7 | 0.9700 | 466.63 | 0.4252 | 496.95 |
While overfitting at t+1, stacked LSTM showed improved stability at longer horizons, especially t+7.
| Horizon | Train R² | Train RMSE | Test R² | Test RMSE |
|---|---|---|---|---|
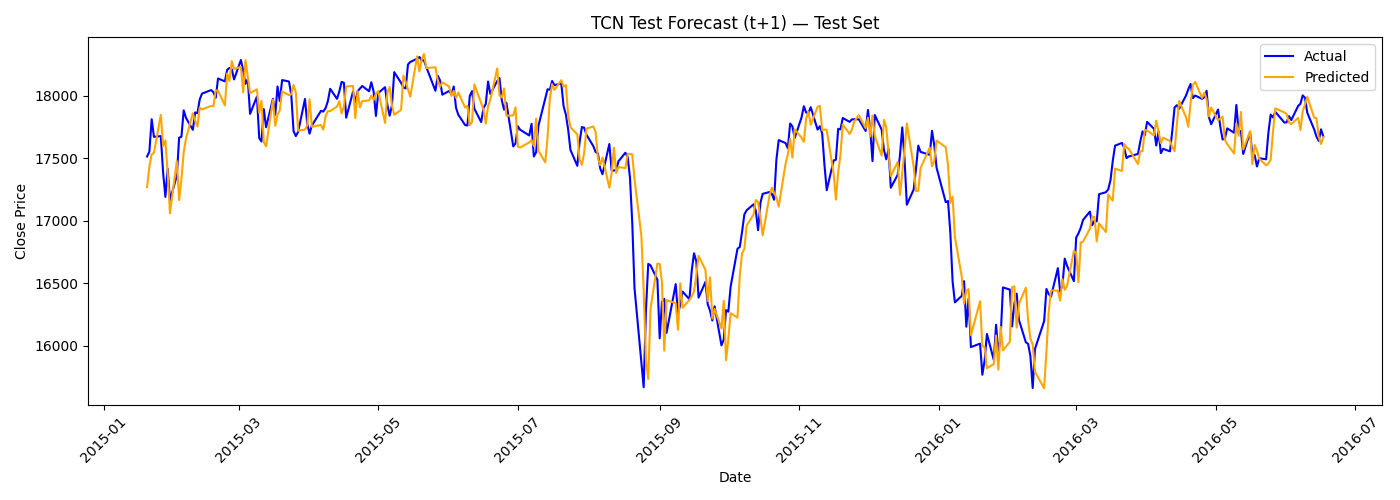
| t+1 | 0.9953 | 186.12 | 0.8767 | 225.27 |
| t+3 | 0.9910 | 257.10 | 0.7584 | 316.20 |
| t+7 | 0.9831 | 351.86 | 0.5483 | 434.50 |
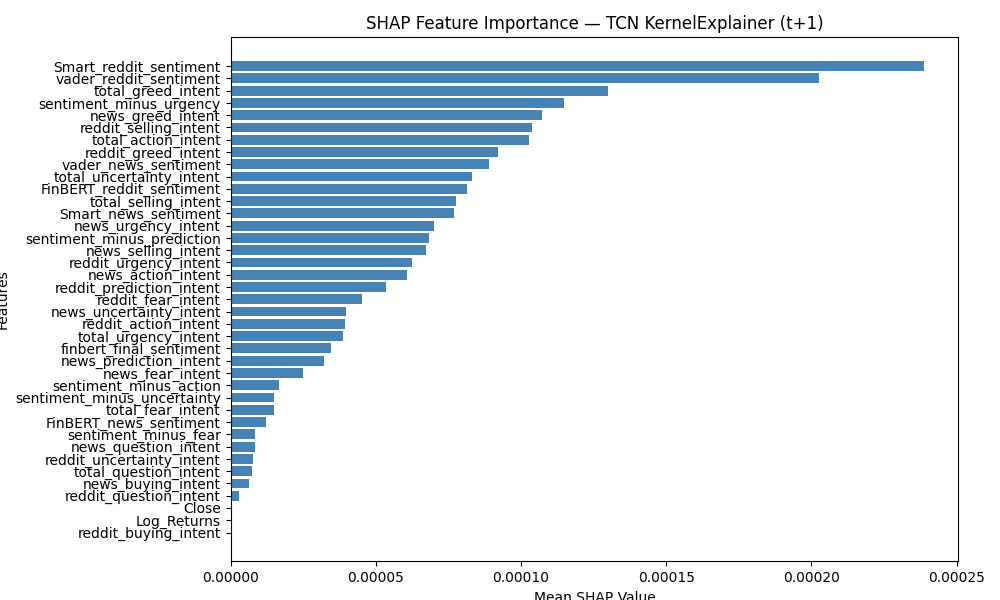
TCN consistently outperformed all other models at t+1 and t+3, showing superior temporal generalization and faster trend adaptation.
Malaviya, A. (2025). Evaluation of Stock Market Prediction Techniques. Dublin City University.
Report (PDF)
