
This project implements a real-time anomaly detection system using two complementary methods:
The system simulates a real-time data stream of floating-point numbers, that could represent various metrics, such as, financial transactions or system metric; and applies both methods in parallel to detect anomalies. It also dynamically updates a live plot to visualize normal data points and detected anomalies.
Out of the many available anomaly detection methods, the combination of Rolling Z-Score and Isolation Forest was chosen because together they provide a balanced and comprehensive solution for real-time data streams, especially those representing complex metrics such as financial transactions or system performance.
Rolling Z-Score is a fast, lightweight statistical method great for quickly spotting sudden, obvious outliers. It is effective in situations where sudden deviations, like transaction spikes or abrupt system malfunctions, need to be flagged in near real-time. However, on its own, it might miss more subtle or slowly developing anomalies that don’t trigger significant short-term deviations. This is where Isolation Forest complements Rolling Z-Score.
Isolation Forest it's a machine learning algorithm, it works on a sliding buffer of recent data and looks for anomalies by isolating them through recursive splitting. This makes it great at catching more complex or subtle changes that might go unnoticed by simpler methods, such as the Rolling Z-Score.
By combining both methods the system can detect both the sudden, obvious spikes and the more subtle, sneaky anomalies. This dual approach ensures that no anomaly, big or small, goes unnoticed, providing a comprehensive and reliable detection system for real-time streams while enhancing the overall accuracy.
How it works: This method calculates the z-score for each data point using a sliding window of recent data. If the z-score exceeds a predefined threshold, the data point is flagged as anomalous.
Parameters:
window_size: The size of the sliding window that stores the recent data points.z_threshold: The z-score threshold for detecting anomalies.How it works: Isolation Forest is an unsupervised machine learning algorithm that isolates anomalies by recursively partitioning the data. Anomalies are easier to isolate and tend to appear in shorter paths within the tree structure of the forest.
Parameters:
contamination: The expected proportion of anomalies in the data.n_estimators: The number of trees in the forest.buffer_size: The size of the buffer that stores the recent data points.The data stream consists of:
Navigate to the project directory:
cd <project-directory>
Install the required packages:
pip install -r requirements.txt
After installing dependencies, run the main script:
python3 main.py
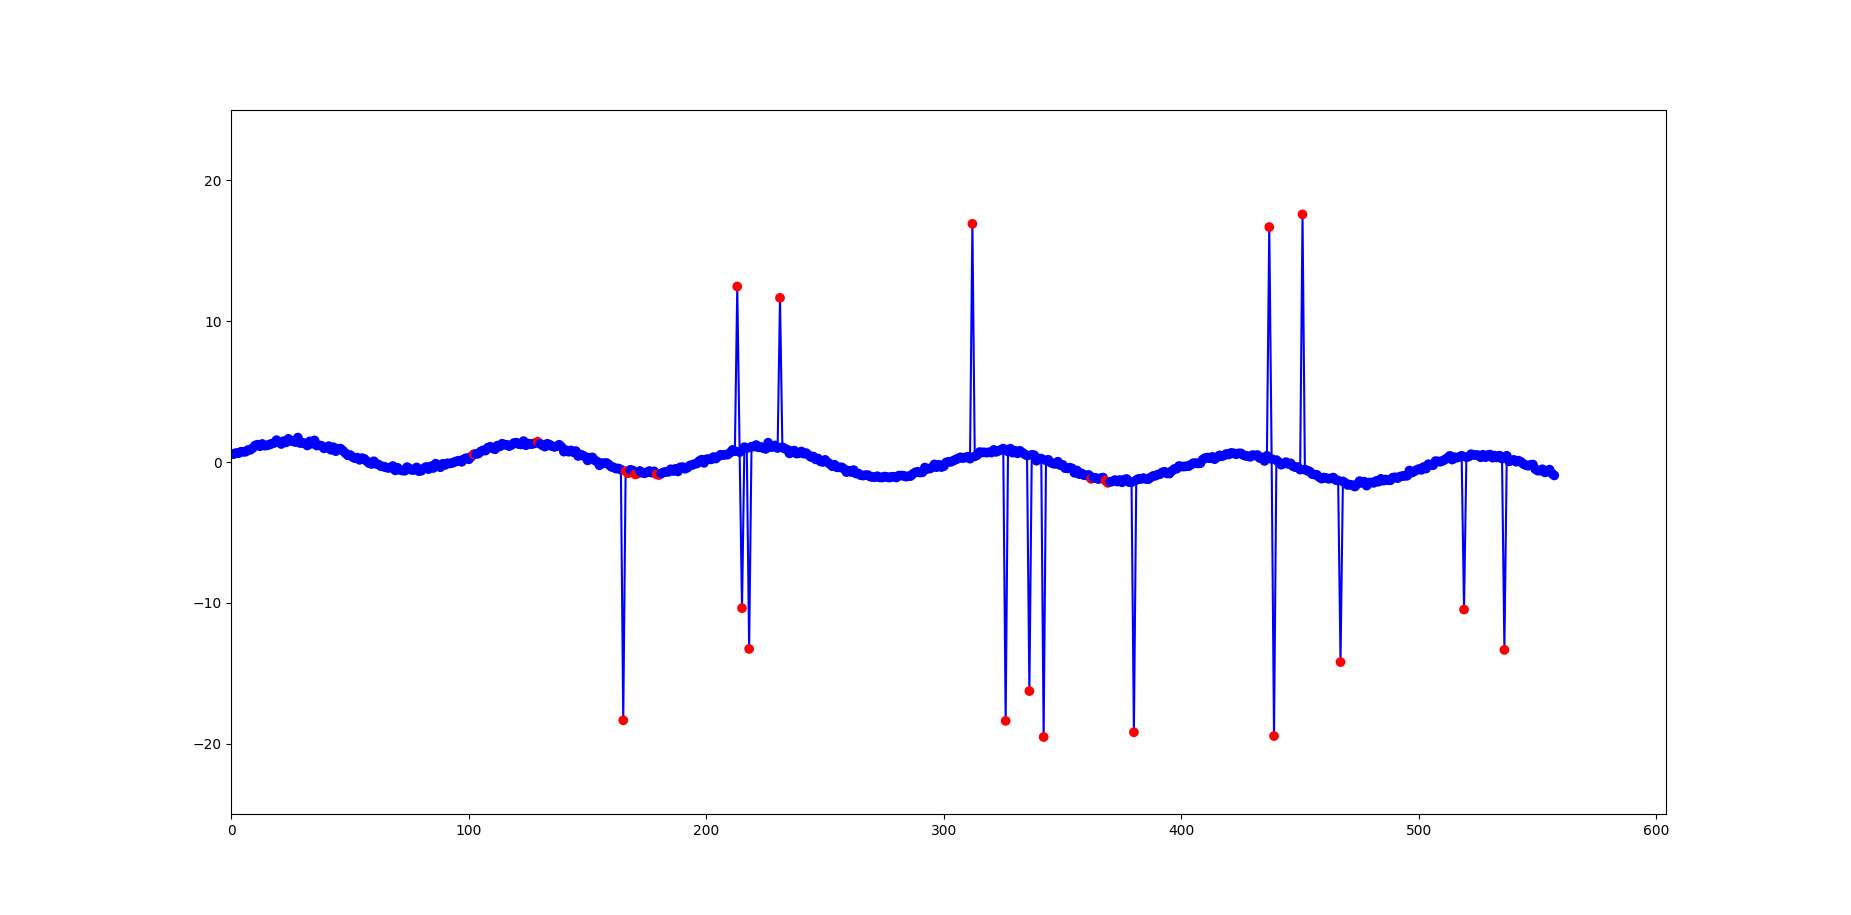
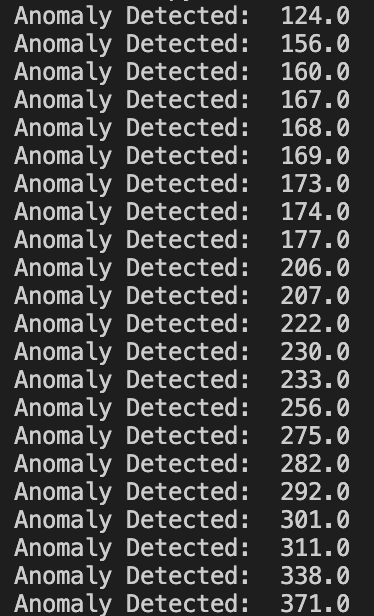
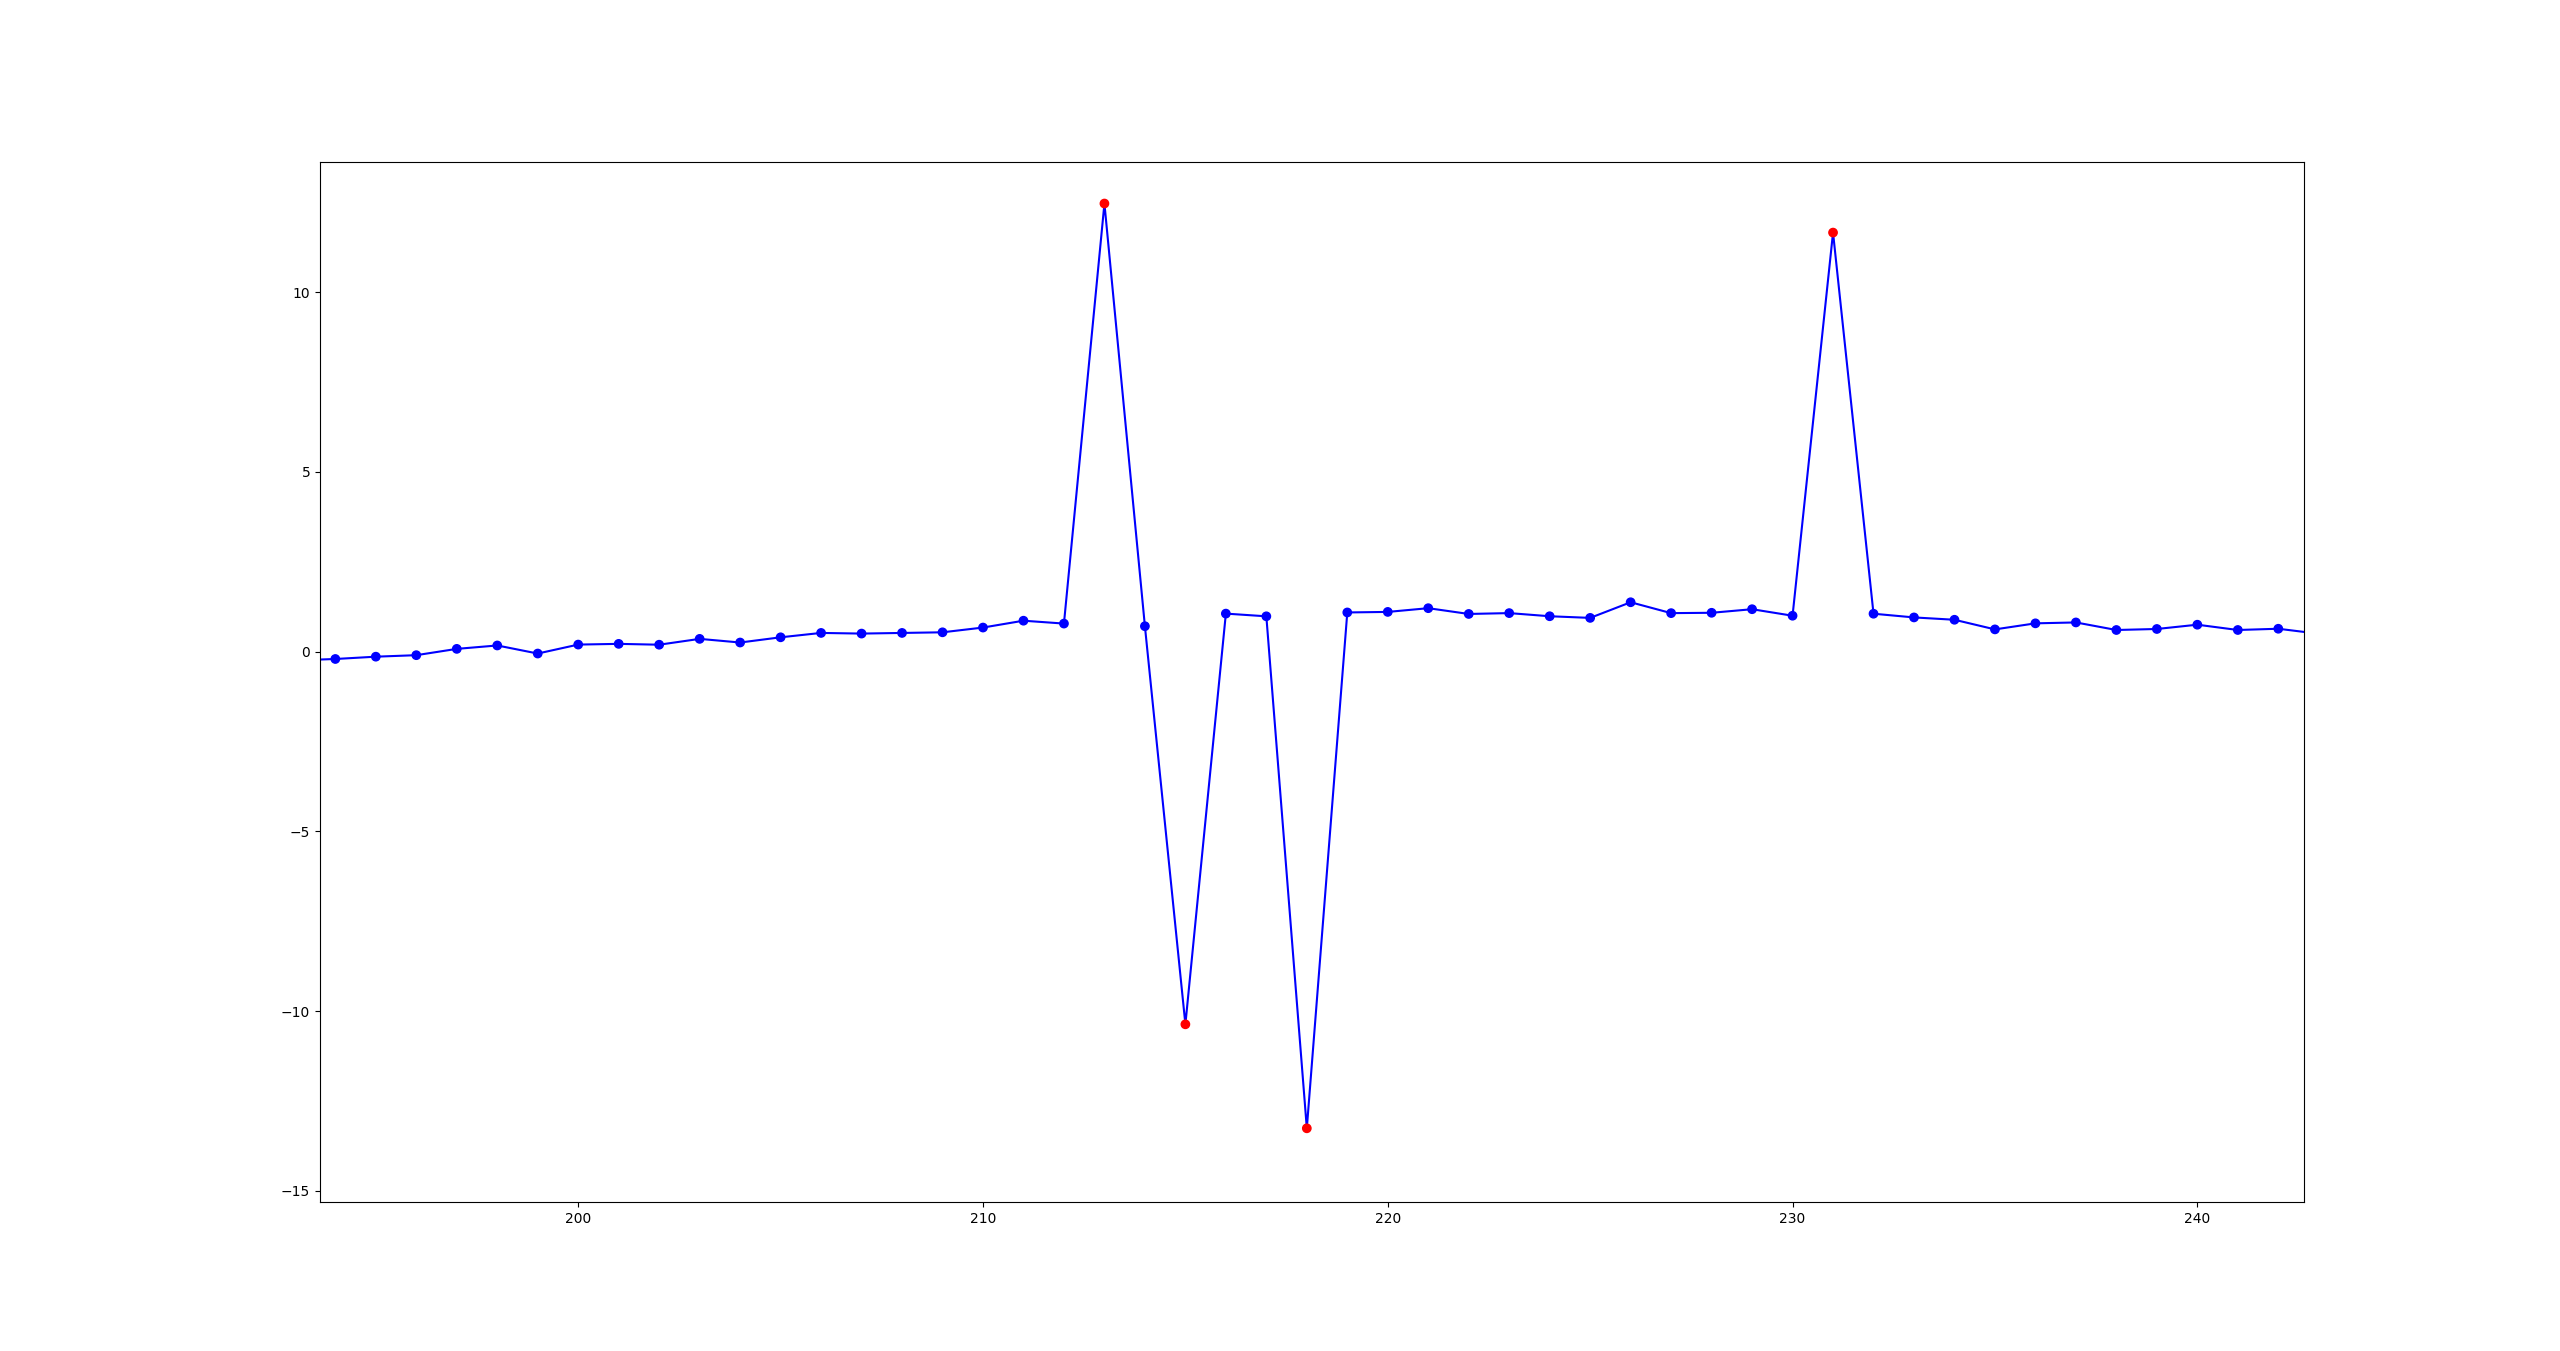
The script will generate a simulated data stream and apply both anomaly detection methods in parallel. A live plot will display the normal data points in blue and detected anomalies in red.
You can stop the program at any time by pressing ctrl+c. This will gracefully shut down the live plot and display the final state of the plot before the program exits.
This project is licensed under the MIT License