DeepGlobe-Land-Cover-Classification-with-DeepLabV3-
Developed a deep learning model using DeepLabV3+ for classifying land cover types from satellite images using the DeepGlobe dataset.
Preparation Script
The file ./Deepglobe_land_cover_classification.ipynb is a data preparation script on Google Colab that handles various steps in preparing the DeepGlobe Land Cover Classification dataset. The steps include:
-
Satellite Image Segmentation: This step involves splitting satellite images into smaller regions or segments to facilitate data analysis.
-
Conversion to One-Hot Encoding Format: Class labels are converted into One-Hot encoding. This means that each class is represented by a binary vector where only the position corresponding to the class is "1," and all others are "0." This allows the use of classification models.
-
Inverse Decoding of One-Hot Encoding Representation: After training a model, the class predictions in One-Hot form are converted back to a more understandable representation, where each pixel of the image has a specific class label.
-
Applying Color Encoding on Image Segmentation Results: The results of segmentation (or predictions) are often color-coded for better visualization. Each class is assigned a specific color, making the results more intuitive and easier to understand.
-
Loading Satellite Images and Their Associated Segmentation Masks: This step loads the satellite images and their associated segmentation masks. Masks are images where each pixel corresponds to a specific class label for each region of the satellite image.
-
Visualization of an Image and Its Mask: Once the images and masks are loaded, this step allows for the visualization of the satellite image and its corresponding segmentation mask to verify the alignment between the data and the labels.
-
Defining Data Augmentations: Data augmentation involves applying various transformations (such as rotation, scaling, etc.) to images to generate new variations of the training data. This helps improve the robustness of the model.
-
Visualizing Applied Augmentations: After defining the augmentations, this step involves displaying the modified images to ensure that the transformations have been correctly applied and that the augmented data is ready for model training.
These steps form a data preparation pipeline designed to make the images and their annotations ready for training an image segmentation model.
DeepLabV3+ Model for Land Cover Classification
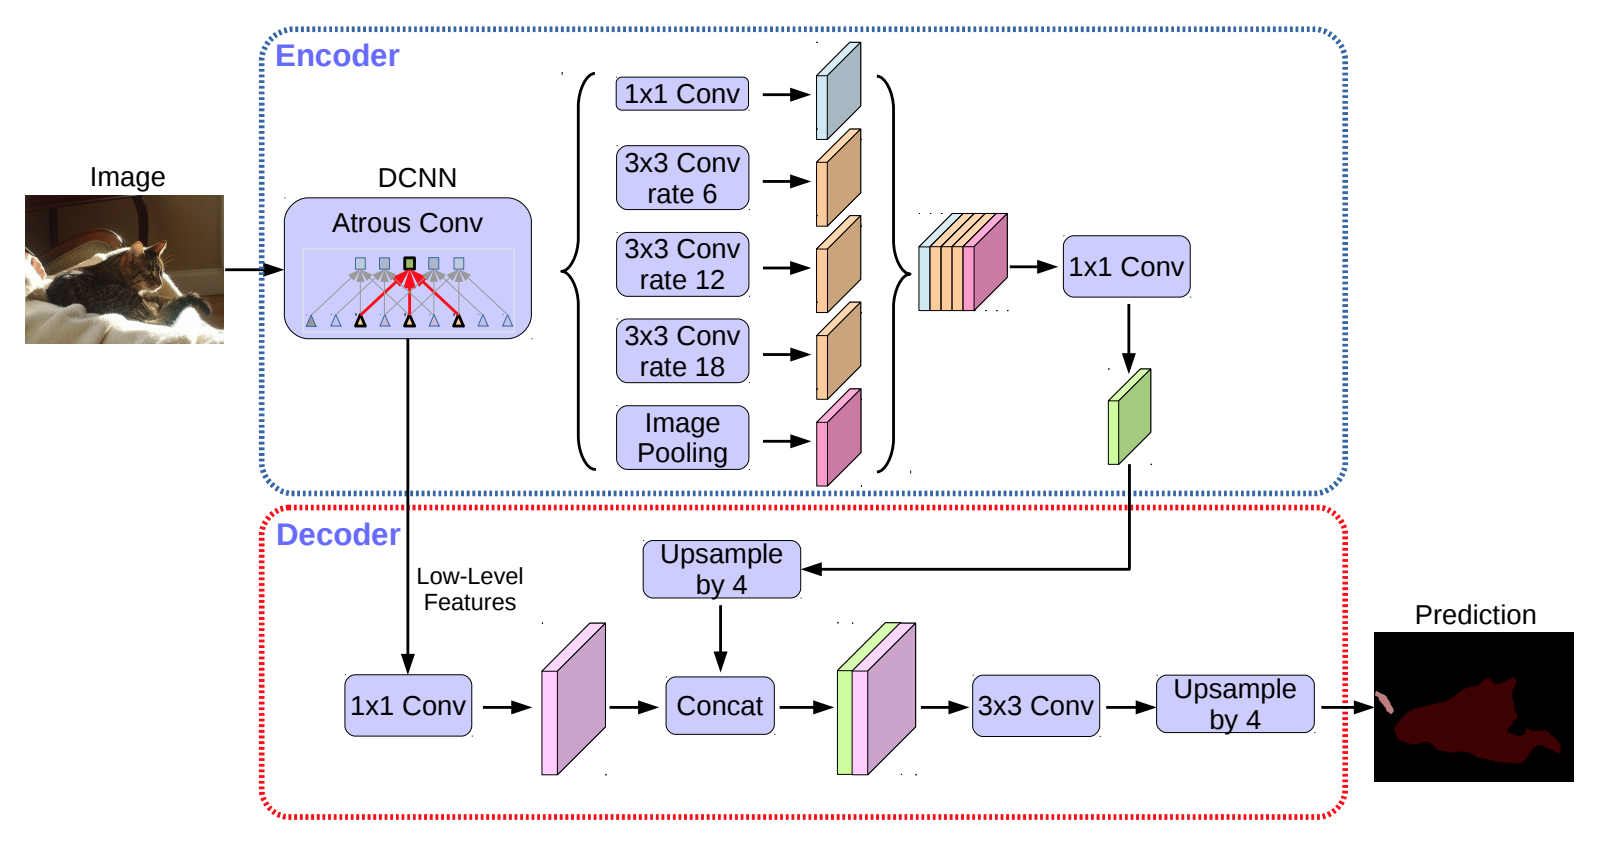
The file ./Modelisation.ipynb is a script that implements the DeepLabV3+ model for image segmentation as part of the land cover classification project using data from the DeepGlobe Land Cover Classification challenge. This notebook contains all the necessary steps for creating, training, and evaluating the model. Here are the different sections of the file and their typical content:
-
Model Definition:
This code initializes and prepares a semantic segmentation model using the DeepLabV3+ architecture with a pre-trained ResNet50 encoder from ImageNet. It is configured for binary segmentation using a sigmoid activation and expects a number of classes defined by the CLASSES variable. A preprocessing function is also created to adapt input images for the model. -
Creating Training and Validation Datasets:
This section prepares the datasets required for training and validating the segmentation model. It uses PyTorch DataLoaders to manage data batches during training, facilitating feeding the model with data and calculating gradients. -
Configuration of Parameters:
Here, the code configures several key elements for training the model using PyTorch and the Segmentation Models PyTorch (smp) library. Parameters include the number of epochs, loss function (typically Dice Loss), optimizer (such as Adam), and learning rate scheduler. It also includes logic to load a pre-trained model if a checkpoint is available. -
Defining TrainEpoch and ValidEpoch:
TrainEpoch and ValidEpoch are objects used to manage the training and validation of the model at each epoch. They calculate losses and metrics for each epoch while displaying detailed information about training and validation progress.
TrainEpoch updates the model weights, while ValidEpoch evaluates its performance without modifying the weights. -
Executing Model Training:
This part of the code is an integral part of the training and validation pipeline. It is designed to train the model over several epochs and save the model if an improvement in the IoU (Intersection over Union) score is observed on the validation set. -
Prediction on Test Data:
After training the model, the script performs predictions on the test data using the best-trained model (the one with the highest IoU score on the validation set). Test images are processed, and the model generates segmentation maps for each image, allowing evaluation of its ability to generalize on unseen data. -
Model Evaluation on Test Data:
The model is then evaluated on the test dataset. Several performance metrics are calculated to assess the quality of the predictions: -
IoU (Intersection over Union): Measures the accuracy of the predicted regions compared to the actual regions.
Dice Coefficient: Another measure of similarity between the predictions and the actual labels, commonly used in segmentation tasks.
These scores are compared to the results obtained on the validation set to verify the model's generalization. -
Visualization of Dice Loss and IoU Curves (Training vs Validation):
To better understand the model's performance during training, the script plots curves comparing Dice Loss and IoU for both the training and validation sets over the epochs. These curves help visualize the model's performance and identify any overfitting or underfitting. -
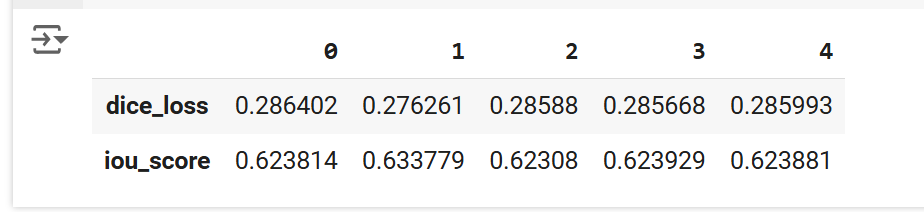
Displaying IoU and Dice Loss Scores:
Finally, summaries are generated to display the final IoU and Dice Loss scores obtained on the training, validation, and test sets. These scores are key indicators of the quality of the segmentations performed by the model and help evaluate its performance in a real-world context.
Architecture DeepLabV3+
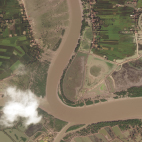
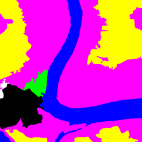
Result
The image on the left is the input satellite image, while the image on the right is the segmentation mask generated by the model, where each pixel of the image is colored according to the land cover class it belongs to.
Blue represents water.
Yellow represents agricultural land.
Green represents forests.
Black represents unknown areas.
White represents barren land.
Magenta represents grazing land.
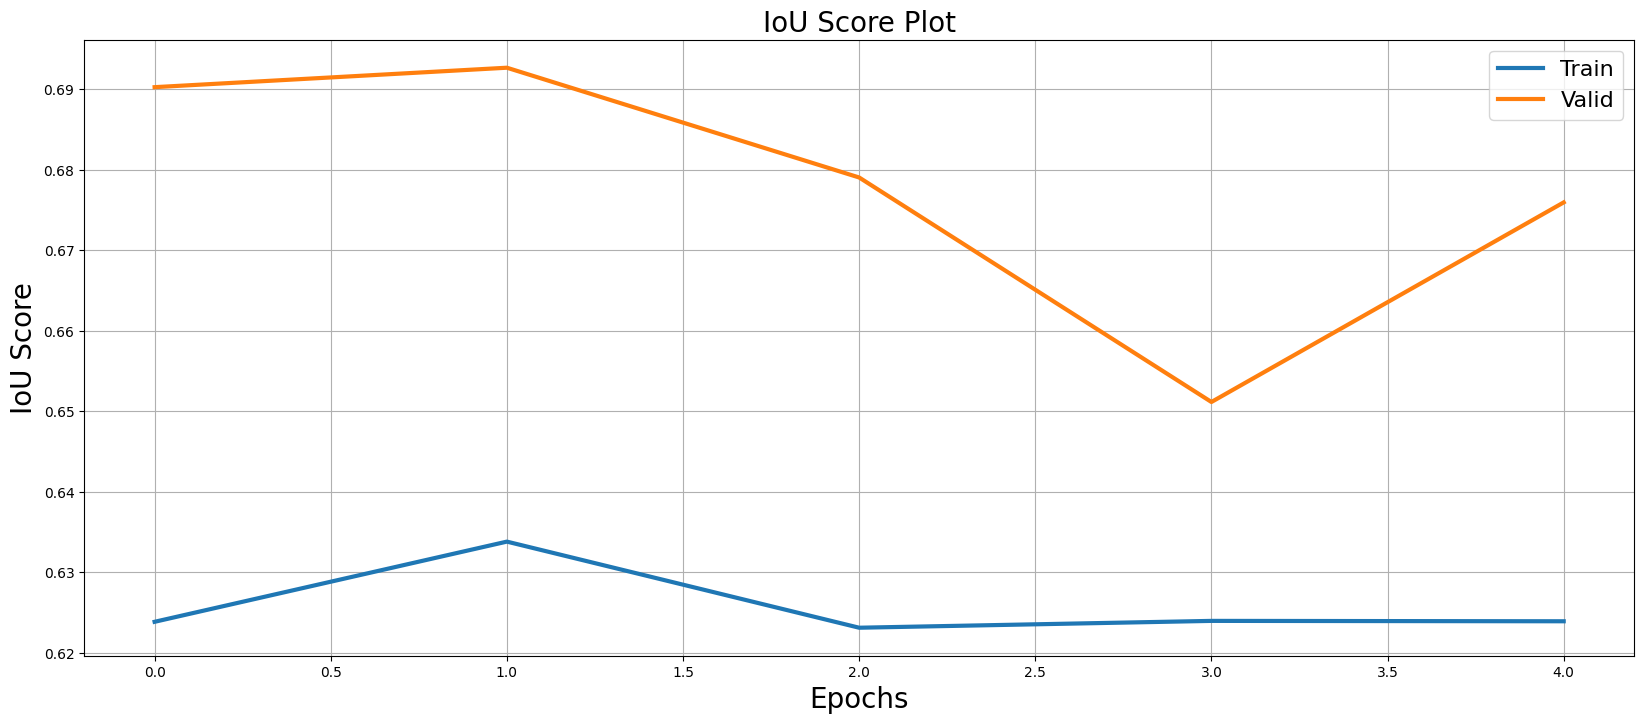
The IoU (Intersection over Union) score is a measure used to evaluate the quality of a model's segmentation. The IoU score ranges from 0 to 1:
0: This means the prediction does not overlap with the actual class at all.
1: This means the prediction exactly matches the ground truth.
The graph suggests that the model performs well in the validation environment, with the IoU score for validation being higher than that for training.
Unlike IoU, a lower Dice Loss is preferable.
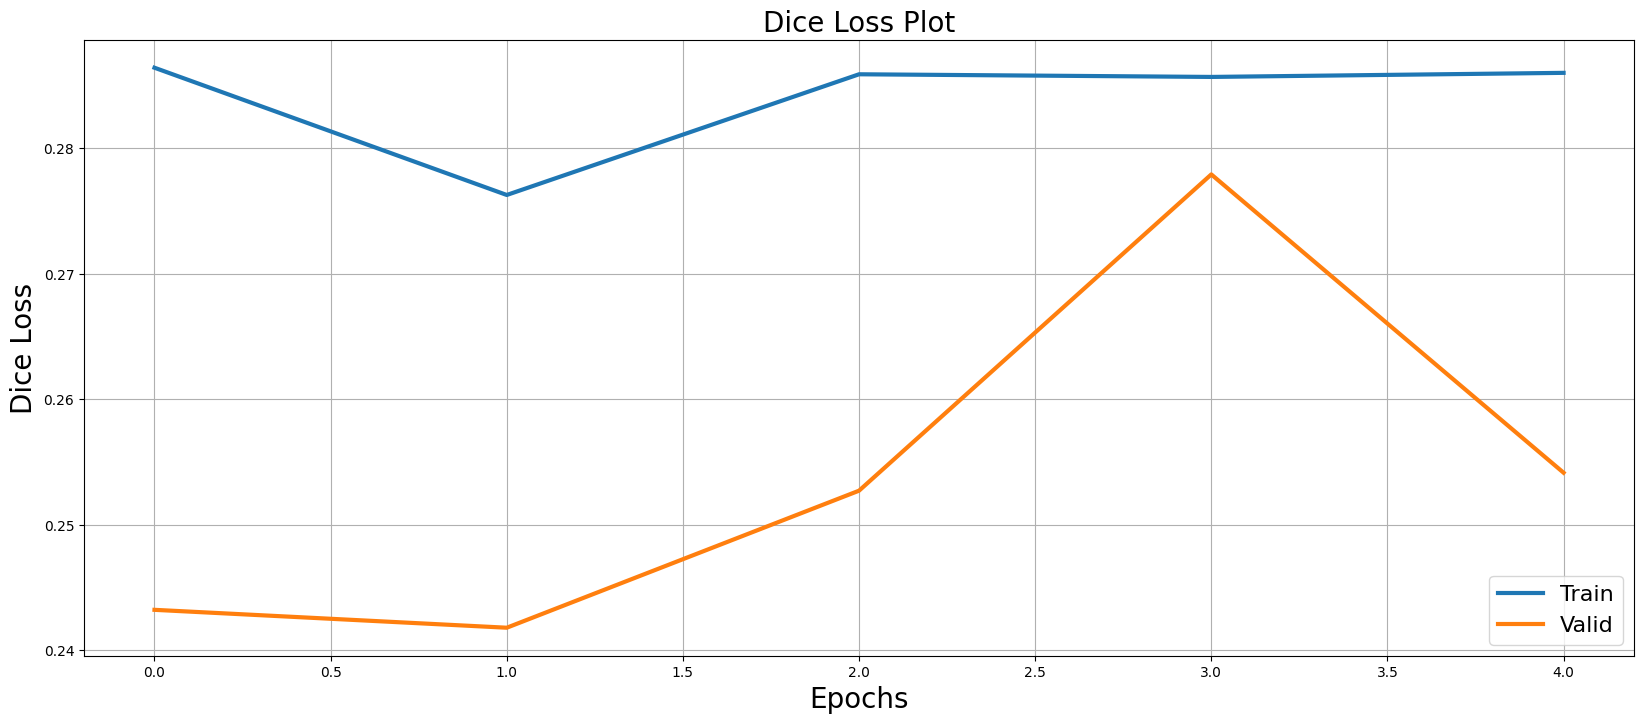
- Dice Loss: There is a slight improvement between epoch 0 and 1 (decrease in Dice Loss), but afterwards, the values seem to stabilize around 0.285, indicating that the model reaches a point where the loss no longer decreases significantly.
- IoU Score: Shows an initial improvement between epoch 0 and 1 (increase in the score), but after that, it fluctuates slightly around 0.623, with the model not making major improvements.