github.com/samrat-kar/ap-cashflow-forecasting-agents
Every finance team faces the same weekly question: "How much cash do we need to pay vendors over the next 30 days — and which payments are at risk?"
Answering it manually means pulling invoice exports, cross-referencing vendor history, building spreadsheet models, and writing summary emails — all before the Monday morning meeting. It's repetitive, error-prone, and consumes hours of an AP analyst's week.
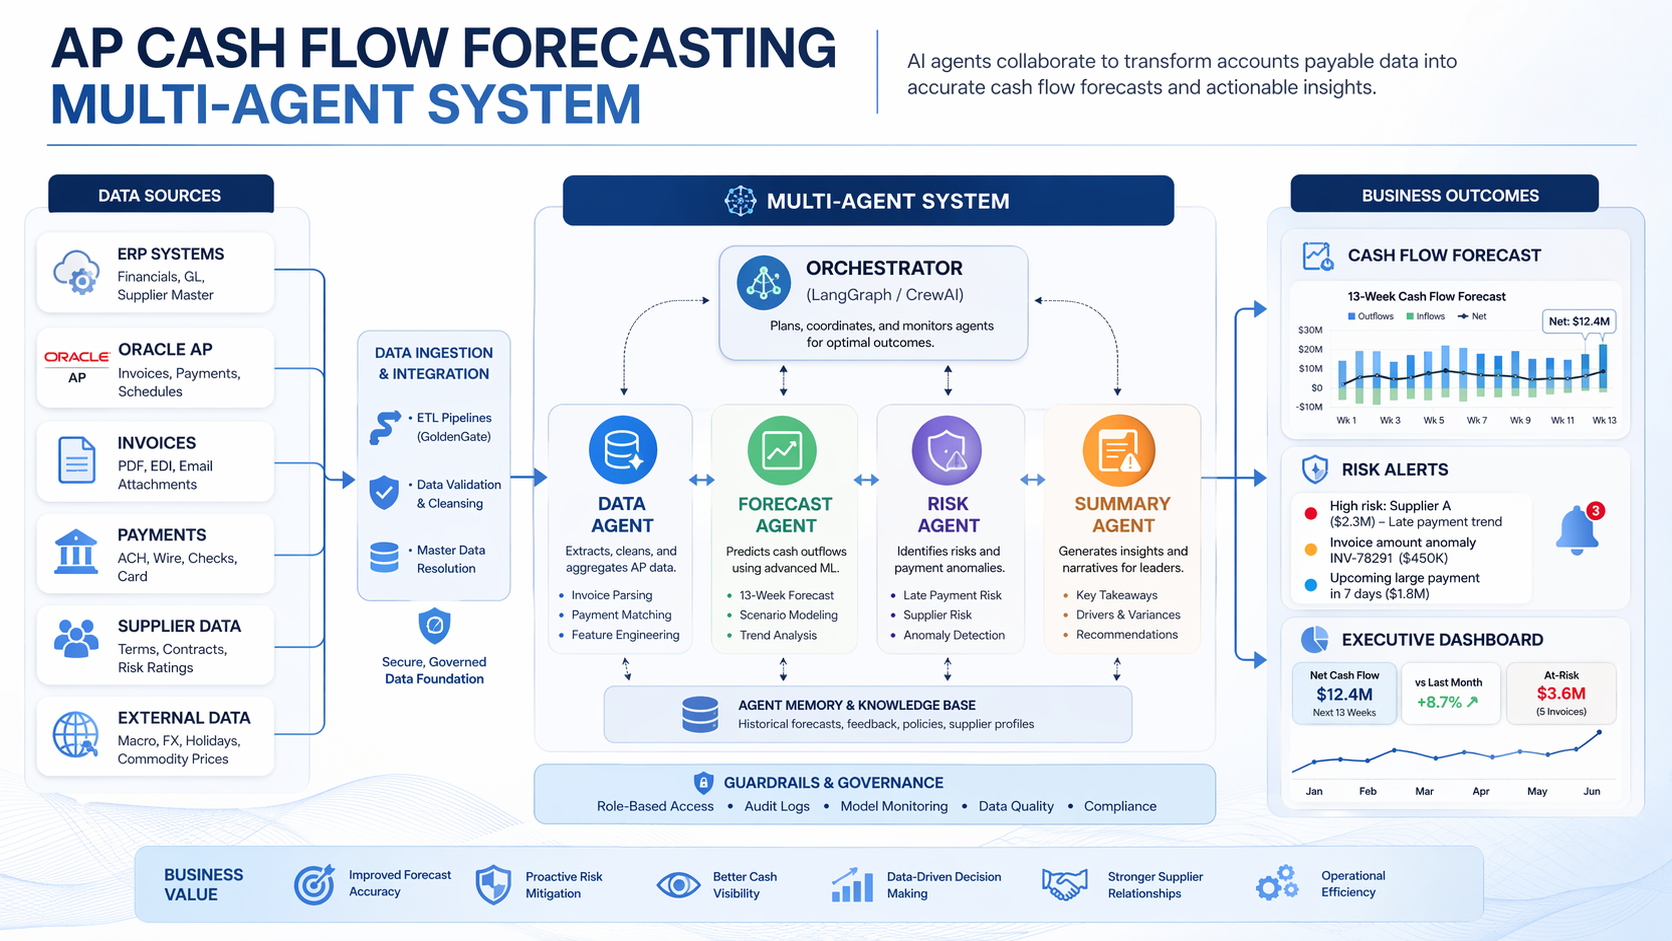
This project automates that entire workflow using a multi-agent AI system built with LangGraph and Claude. Four specialized agents collaborate to ingest AP data, learn vendor payment behavior, identify financial risks, and deliver a CFO-ready report — with a human approval step built in before anything goes out.
The system follows a linear pipeline orchestrated by a LangGraph StateGraph. Each agent is a node in the graph, and all agents share a typed state object that accumulates data as it flows through the pipeline.
START
  │
  ▼
[Data Ingestion Agent]
  │── data issues? ──► [Error Node] ──► END
  │── data clean?
  ▼
[Forecasting Agent]
  │
  ▼
[Risk Assessment Agent]
  │
  ▼
[Human-in-the-Loop] (optional approval gate)
  │── approved?
  ▼
[Reporting Agent]
  │
  ▼
END → forecast_report.md + cashflow_chart.png
All agents read from and write to a single APForecastState TypedDict. This is what LangGraph manages — each agent receives the full state, does its work, and returns an updated copy:
class APForecastState(TypedDict):
    open_invoices: list[dict]
    payment_history: list[dict]
    vendor_master: list[dict]
    data_quality_issues: list[str]
    vendor_payment_patterns: dict       # vendor_id -> avg_days_variance
    forecast_schedule: list[dict]       # [{date, projected_amount, invoice_ids}]
    risk_flags: list[dict]
    discount_opportunities: list[dict]
    report_path: str
    chart_path: str
    human_approved: bool
This design keeps agents fully decoupled — each one only needs to know about the state schema, not about any other agent.
Role: Load, validate, and clean raw AP data from three CSV files.
The ingestion agent uses two tools deterministically (no LLM required for the mechanical work):
csv_loader_tool — reads vendors.csv, open_invoices.csv, and payment_history.csvdata_validation_tool — checks for missing required fields, malformed dates, and negative amountsIf data quality issues are found, the LLM is called to summarize them in plain English for the finance team. If critical issues exist (missing required fields), the graph routes to an error node and stops. Minor issues are logged as warnings but processing continues.
def ingestion_agent(state: APForecastState) -> APForecastState:
    invoices = csv_loader_tool.invoke({"file_path": config.INVOICES_PATH})
    history  = csv_loader_tool.invoke({"file_path": config.HISTORY_PATH})
    vendors  = csv_loader_tool.invoke({"file_path": config.VENDORS_PATH})

    issues = data_validation_tool.invoke({
        "invoices": invoices,
        "payment_history": history,
        "vendors": vendors,
    })
    # LLM summarizes issues if any are found...
    return {**state, "open_invoices": invoices, "payment_history": history,
            "vendor_master": vendors, "data_quality_issues": issues}
Key design principle: The LLM is used for communication (explaining issues), not computation. All data checks are deterministic Python.
Role: Project cash outflows for the next 30 days by learning each vendor's historical payment timing.
This agent answers: "When will we actually pay each invoice, given how this vendor typically behaves?"
It uses two tools:
payment_pattern_tool — groups 12 months of payment history by vendor and calculates each vendor's average days_variance (negative = pays early, positive = pays late)forecast_calculator_tool — adjusts each open invoice's due date by its vendor's average variance, then aggregates projected amounts by expected payment dateFor example, if Freight Fast typically pays 5 days late, an invoice due April 1st gets scheduled for April 6th in the forecast.
patterns = payment_pattern_tool.invoke({"payment_history": state["payment_history"]})
# Result: {"V001": -0.5, "V005": 5.38, "V007": 5.35, ...}

forecast = forecast_calculator_tool.invoke({
    "open_invoices": state["open_invoices"],
    "vendor_payment_patterns": patterns,
    "forecast_horizon_days": 30,
})
# Result: [{"date": "2026-04-05", "projected_amount": 13240.0, "invoice_ids": [...]}, ...]
After the deterministic computation, the LLM generates a 2-sentence finance briefing summarizing the forecast and flagging any vendors with significant payment delays.
Sample LLM output:
Over the next 30 days, we have $100,702 in projected AP outflows concentrated across 13 payment days. Vendors V005 and V007 are averaging payment delays of 5+ days, which may signal invoice processing bottlenecks that warrant follow-up.
Role: Identify financial risks and opportunities in the forecast.
Three tools run in sequence, each scanning for a different type of risk:
| Tool | What it finds |
|---|---|
discount_opportunity_tool | Invoices where early-pay discount window closes within 3 days |
late_penalty_tool | High-risk vendors (reliability < 80%) with large upcoming invoices |
cash_gap_tool | Days where projected outflow exceeds the $15,000 cash threshold |
The LLM then synthesizes all findings into a 3-bullet executive summary for the CFO.
Sample LLM output:
- Late Payment Exposure: Three invoices are at risk of late payment, which could result in penalty fees and strained vendor relationships.
- Early Payment Opportunity: One invoice qualifies for an early payment discount — $123.65 in potential savings if paid by tomorrow.
- Recommended Action: Prioritize clearing the three at-risk invoices while fast-tracking the discount-eligible payment.
Role: Compile all agent outputs into a structured, human-readable deliverable.
Two tools:
chart_generator_tool — generates a 30-day bar chart of projected daily outflows using matplotlib. Bars exceeding the $15k threshold are highlighted in red.report_writer_tool — assembles a markdown report with executive summary, weekly breakdown table, risk flags, and recommended actions.Sample report output:
# AP Cash Flow Forecast Report
**Generated:** 2026-03-21
**Forecast Period:** 2026-03-21 to 2026-04-20

## Executive Summary
- Total projected outflows (30 days): **$100,702**
- Largest single-day exposure: **$13,240** on 2026-04-05
- Early payment discount opportunities: **1 alert** (savings: $123.65)
- High-risk late payment flags: **3 alerts**

## Weekly Breakdown
| Week         | Projected Outflow | Invoice Count |
|--------------|------------------|---------------|
| Mar 21–27    | $0               | 0             |
| Mar 28–Apr 3 | $9,822           | 3             |
| Apr 4–10     | $55,049          | 8             |
| Apr 11–20    | $35,831          | 6             |
Before the reporting agent runs, the graph pauses and shows the finance team a summary of the forecast:
============================================================
HUMAN REVIEW REQUIRED
============================================================
Total 30-day projected outflow: $100,702
Payment days in forecast: 13
Risk flags: 3
Discount opportunities: 1
============================================================
Approve forecast and generate report? [y/N]:
If approved, the graph continues to the reporting agent. If declined, the pipeline exits cleanly without generating a report. This gate ensures a human validates the numbers before anything is shared with leadership.
This is implemented as a standard LangGraph node with conditional routing:
def route_after_human_review(state: APForecastState) -> str:
    return "report" if state.get("human_approved", False) else END
Human approval can be disabled entirely by setting ENABLE_HUMAN_APPROVAL=false in .env for automated/scheduled runs.
All 9 tools follow the same principle: deterministic Python logic, no LLM inside tools.
The LLM is reserved for tasks that genuinely benefit from language understanding — summarizing findings, generating briefings, explaining data quality issues. Everything else — loading files, computing averages, filtering by dates, aggregating amounts — is plain Python. This makes the system:
# Example: payment_pattern_tool — pure Python, no LLM
@tool
def payment_pattern_tool(payment_history: list[dict]) -> dict[str, float]:
    totals: dict[str, list[float]] = {}
    for row in payment_history:
        vid = row.get("vendor_id")
        variance = float(row["days_variance"])
        totals.setdefault(vid, []).append(variance)
    return {vid: round(sum(vals) / len(vals), 2) for vid, vals in totals.items()}
The project includes a data generator (data/generate_data.py) that produces realistic AP datasets:
Key realism features:
reliability_score that shapes their payment timing distribution19 unit and integration tests covering all tools and the data pipeline:
pytest tests/ -v

# Sample output:
# test_tools.py::test_payment_pattern_tool_calculates_mean_variance PASSED
# test_tools.py::test_discount_opportunity_tool_flags_closing_windows PASSED
# test_tools.py::test_data_validation_tool_catches_missing_due_date PASSED
# test_tools.py::test_cash_gap_tool_flags_high_days PASSED
# test_tools.py::test_late_penalty_tool_flags_high_risk_vendors PASSED
# ... 19 passed in 0.41s
1. Separate computation from communication.
The biggest architectural decision was keeping LLMs out of tools entirely. Early prototypes had the LLM computing payment averages — which was slower, less reliable, and harder to test. Moving all computation to pure Python and using the LLM only for summaries made the system dramatically more robust.
2. Typed shared state is essential for multi-agent systems.
Using TypedDict for APForecastState caught dozens of potential bugs early. When every agent knows exactly what fields exist and what types they hold, integration is clean and debugging is fast.
3. Human-in-the-loop is easy to add and hard to justify skipping.
Adding the approval gate took about 10 lines of code. For any system that produces outputs a human will act on — especially financial ones — that gate is worth it.
4. LangGraph makes agent coordination transparent.
Being able to see the full state graph as a diagram, trace exactly which node ran and what it wrote to state, and add conditional routing with a simple function made debugging much easier than callback-based approaches.
git clone https://github.com/samrat-kar/ap-cashflow-forecasting-agents
cd ap-cashflow-forecasting-agents
pip install -r requirements.txt
cp .env.example .env        # add your ANTHROPIC_API_KEY
python data/generate_data.py
python main.py
Report and chart will be saved to output/.
