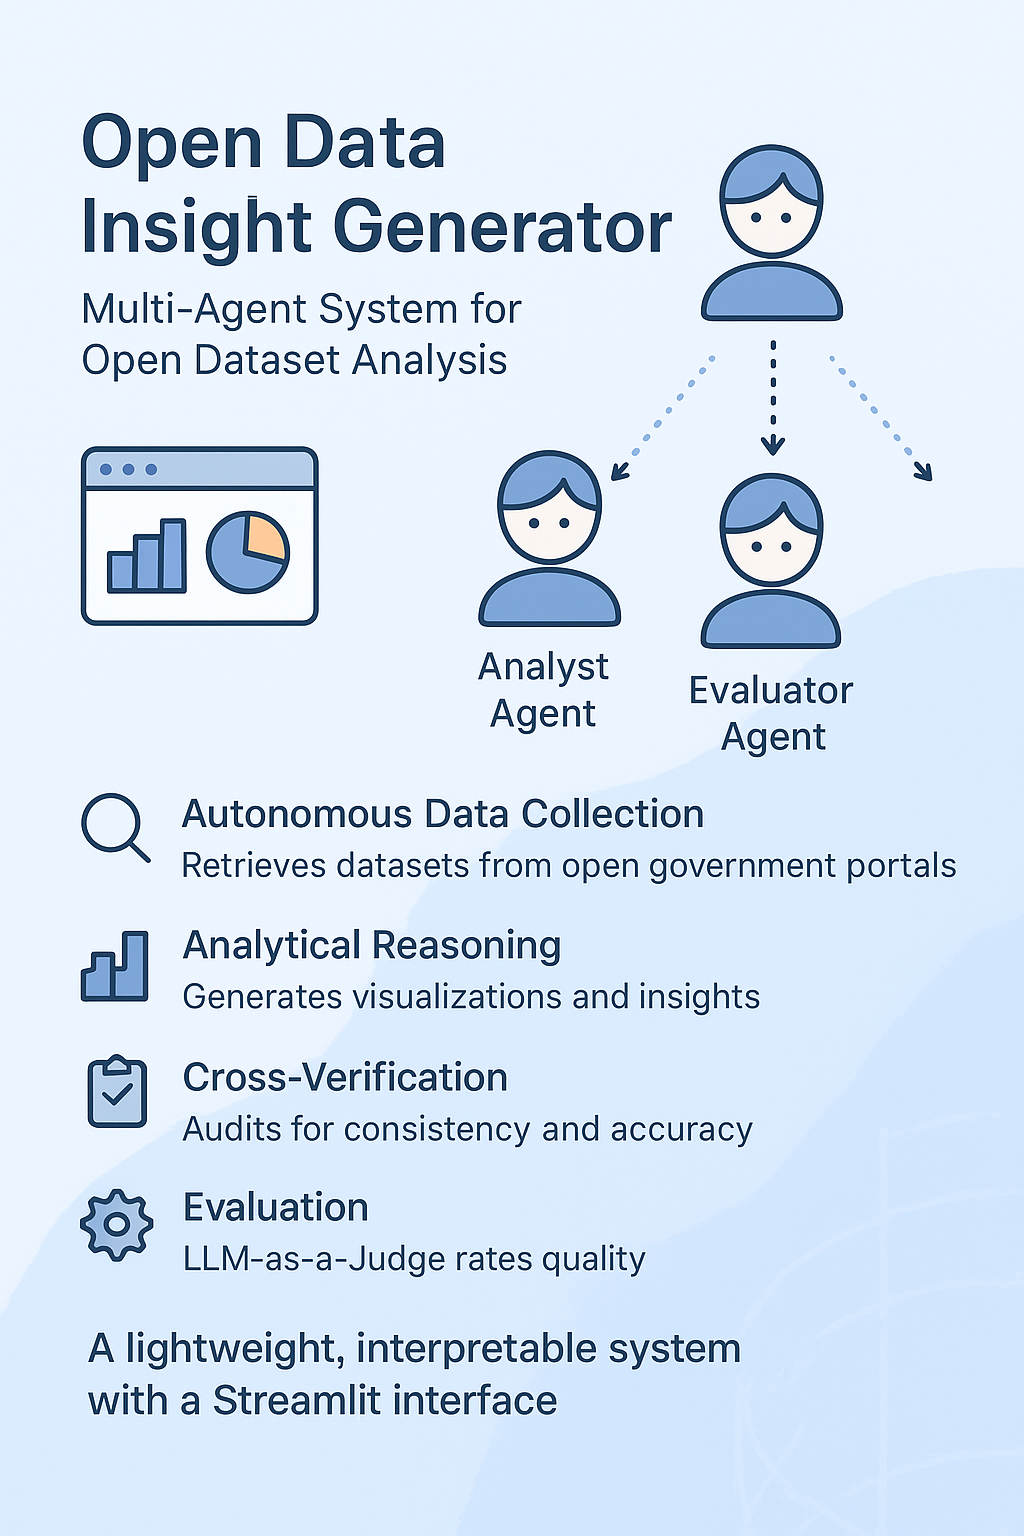
Open Data Insight Generator is a multi-agent analytics pipeline that turns open government datasets into validated insights, visualizations, and audit trails. LangGraph-driven orchestration coordinates data collection, statistical analysis, automated auditing, and LLM-based evaluation so policy analysts and civic technologists can publish decision-ready briefs without touching raw data.
Modern public-sector teams struggle to translate sprawling Data.gov inventories into trustworthy narratives. This project automates the path from a natural-language question to a vetted insight pack: datasets are fetched with license checks, cleaned, analyzed, visualized, numerically audited, and finally scored by an LLM judge for clarity, honesty, and statistical soundness. The modular design mirrors human analyst roles, which simplifies monitoring, extension, and integration into existing research workflows.
        workflow.add_edge("data_collector", "analyst")
        workflow.add_edge("analyst", "auditor")
        workflow.add_edge("auditor", "evaluator")
        workflow.add_edge("evaluator", END)
Each run outputs machine-readable artifacts (insights.json, validation_report.txt, evaluation_results.json) and visualization assets so downstream platforms can render dashboards or PDF briefings without rerunning the pipeline.
The solution targets open government datasets, with a primary integration into the Data.gov catalog and support for civic competitions and research corpora hosted on Kaggle. Data.gov’s CKAN APIs deliver structured metadata and license signals, while Kaggle expands the domain to global civic, climate, and mobility datasets—together covering the bulk of Ready Tensor’s government analytics use cases.
A typed LangGraph state machine orchestrates specialized agents so each stage can focus on a single responsibility while sharing context through structured state payloads.
        for dataset_name, df in datasets.items():
            print(f"  Analyzing {dataset_name}...")
            statistics = self._compute_statistics(df)
            visualization_paths = {}
            if generate_visualizations:
                plots = self.visualization_tool.generate_summary_plots(df)
                visualization_paths = {k: str(v) for k, v in plots.items()}
            insights_text = self._generate_insights(df, statistics)
            all_insights[dataset_name] = {
                "statistics": statistics,
                "insights_text": insights_text,
                "visualizations": visualization_paths,
                "data_summary": get_data_summary(df)
            }
DatasetResult models enforce schema guarantees and track license/file-type compliance during collection.if dataset_id: try: dataset_info = self.data_gov_client.get_dataset(dataset_id) # ... existing code ... if "public domain" in license_info or "open" in license_info or "cc0" in license_info: license_verified = True except Exception as e: errors.append(f"Failed to verify license: {e}") result = DatasetResult( datasets=validated_datasets, metadata=metadata, license_verified=license_verified, file_types_valid=file_types_valid, errors=errors )
        result = {
            "valid": True,
            "score": 0.0,
            "issues": [],
            "warnings": [],
            "metrics": {}
        }
        # ... existing code ...
        score = max(0.0, score)
        result["metrics"] = metrics
        result["issues"] = issues
        result["warnings"] = warnings
        result["score"] = score
        result["valid"] = score >= settings.min_data_quality_score
        return result
class Settings(BaseSettings):
    """Application settings."""
    kaggle_username: Optional[str] = Field(default=None, description="Kaggle username")
    # ... existing code ...
    def validate(self) -> None:
        """Validate required settings."""
        errors = []
        # ... existing code ...
        self.data_dir.mkdir(parents=True, exist_ok=True)
        self.output_dir.mkdir(parents=True, exist_ok=True)
Automated validation runs at multiple layers. The Auditor Agent recomputes descriptive statistics and numeric claims, deducing confidence scores and polishing a discrepancy log. Concurrently, the Evaluator Agent applies NumericValidator heuristics plus LLM qualitative scoring to produce accuracy, clarity, soundness, and honesty ratings—effectively a regression suite against statistical drift.
        result = {
            "overall_valid": True,
            "confidence_score": 1.0,
            "statistical_checks": [],
            "numeric_checks": [],
            "errors": [],
            "warnings": [],
            "discrepancies": []
        }
        # ... existing code ...
        if result["errors"]:
            result["overall_valid"] = False
        return result
            numeric_eval = self._evaluate_numeric_accuracy(
                insights,
                dataset_name,
                dataset_metadata.get(dataset_name, {})
            )
            qualitative_eval = self._evaluate_qualitative(
                insights,
                auditor_validation,
                dataset_metadata.get(dataset_name, {})
            )
            evaluation_result = {
                "dataset_name": dataset_name,
                "accuracy_score": qualitative_eval.get("accuracy_score", 5.0),
                "clarity_score": qualitative_eval.get("clarity_score", 5.0),
                "soundness_score": qualitative_eval.get("soundness_score", 5.0),
                "honesty_score": qualitative_eval.get("honesty_score", 5.0),
                "numeric_accuracy": numeric_eval.get("accuracy", 0.0),
                "justification": qualitative_eval.get("justification", {}),
                "discrepancies": auditor_validation.get("errors", [])
            }
License verification, file-type constraints, dataframe validation, and statistical guardrails enforce that only open, structured, and numerically stable datasets advance. If Data.gov metadata lacks explicit licensing, the collector flags the uncertainty for reviewer attention. Downstream agents operate on typed inputs, decreasing the probability of prompt injection or schema drift when piping insights across agents.
Guarded try/except blocks at each stage surface descriptive errors to the console, while partially successful stages still persist their outputs for later diagnosis. Evaluation metrics, discrepancy lists, and confidence scores provide monitoring signals that can be scraped into dashboards or alerts. All generated reports land in a versionable output directory so operators can trace regressions across runs.
    print("=" * 80)
    print("Open Data Insight Generator")
    # ... existing code ...
    try:
        if args.dataset == "kaggle":
            # ... existing code ...
        elif args.dataset == "data-gov":
            # ... existing code ...
        else:
            print("Error: --dataset required or use --query for query-based search")
            return
        datasets = data_result["datasets"]
        metadata = data_result["metadata"]
    except Exception as e:
        print(f"✗ Failed to collect dataset: {e}")
        return
        insights = analyst.analyze(
            datasets,
            generate_visualizations=not args.no_viz
        )
        insights_path = output_dir / "insights.json"
        analyst.save_insights(insights, str(insights_path))
        # ... existing code ...
        report_path = output_dir / "validation_report.txt"
        # ... existing code ...
        eval_report_path = output_dir / "evaluation_report.txt"
        with open(eval_report_path, 'w', encoding='utf-8') as f:
            f.write(eval_report)
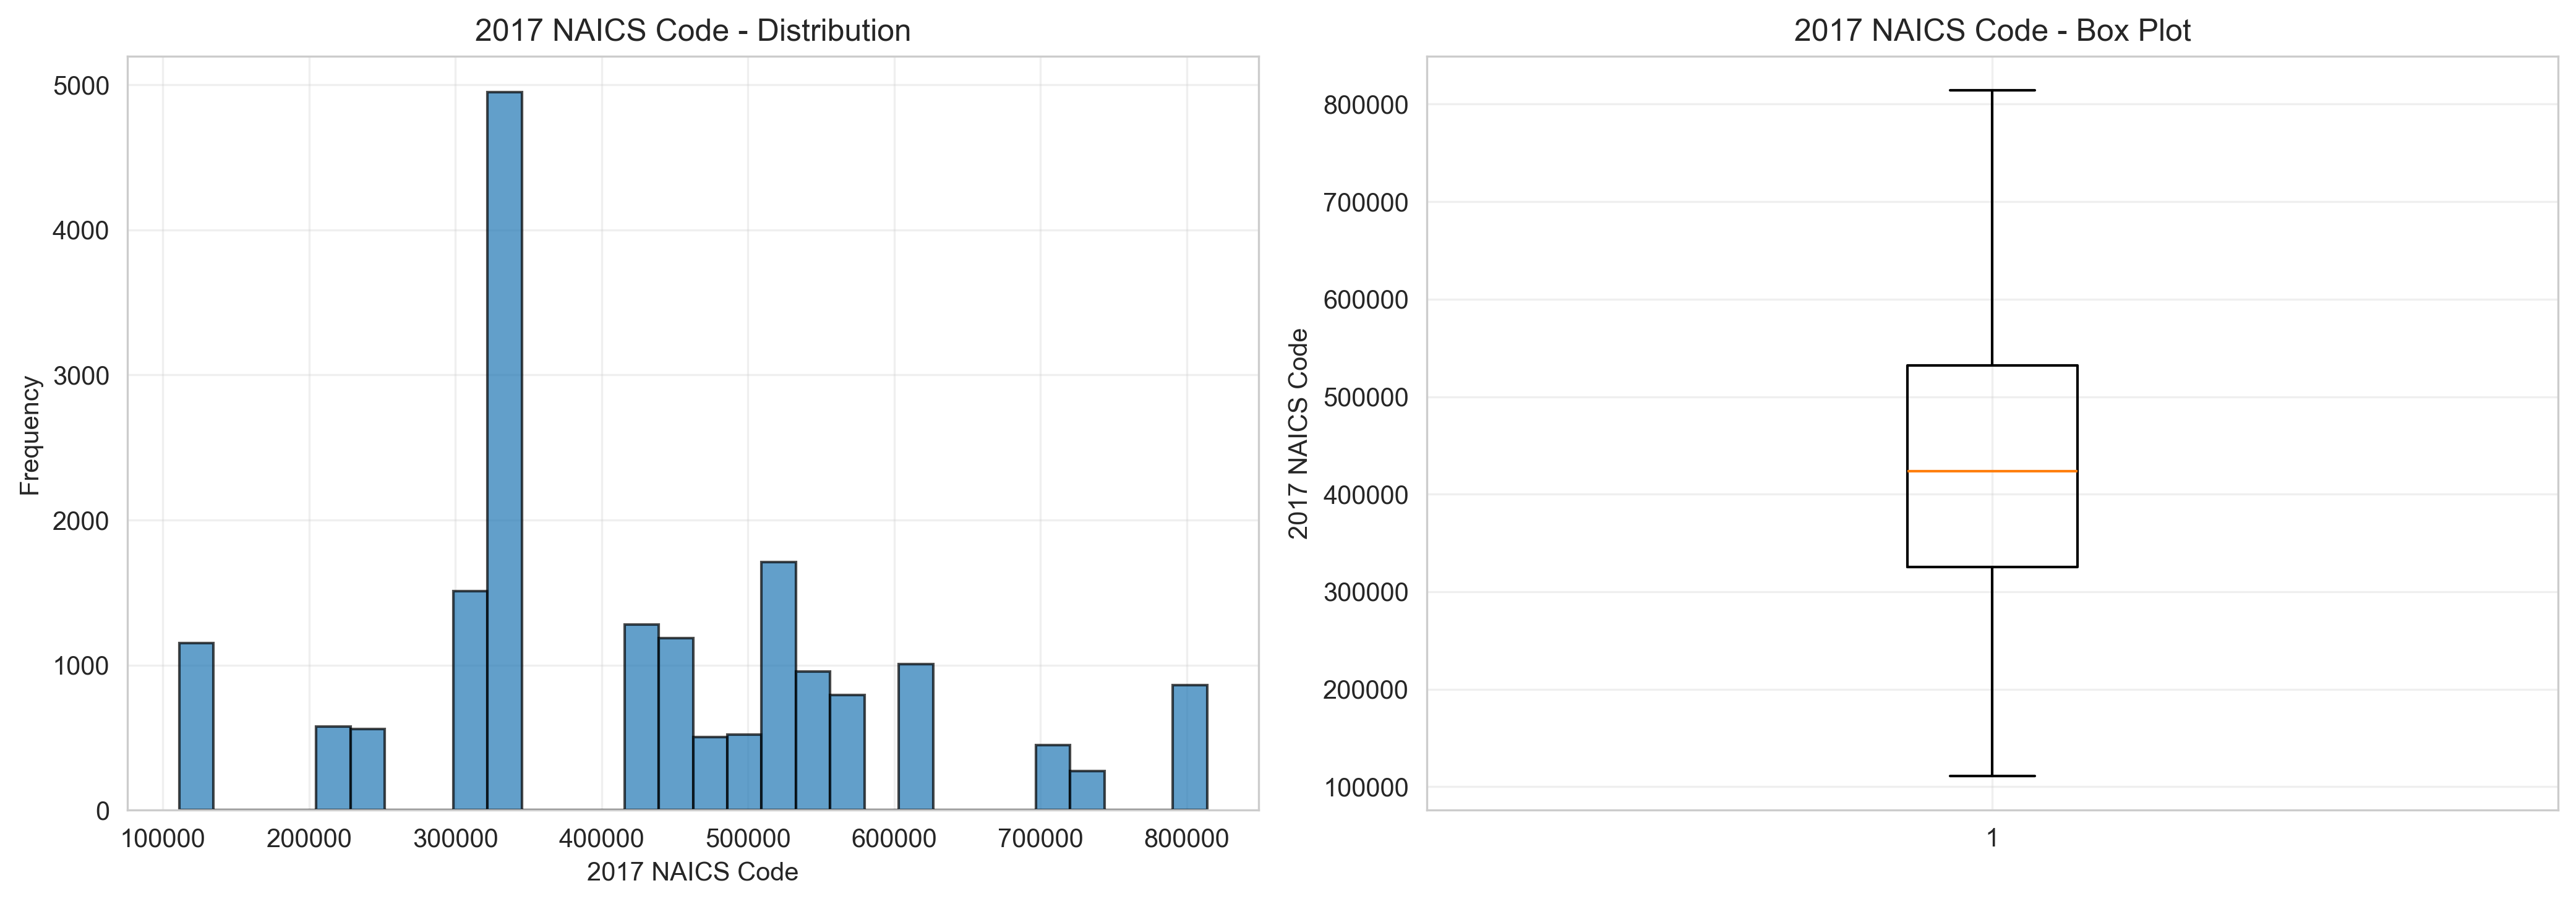
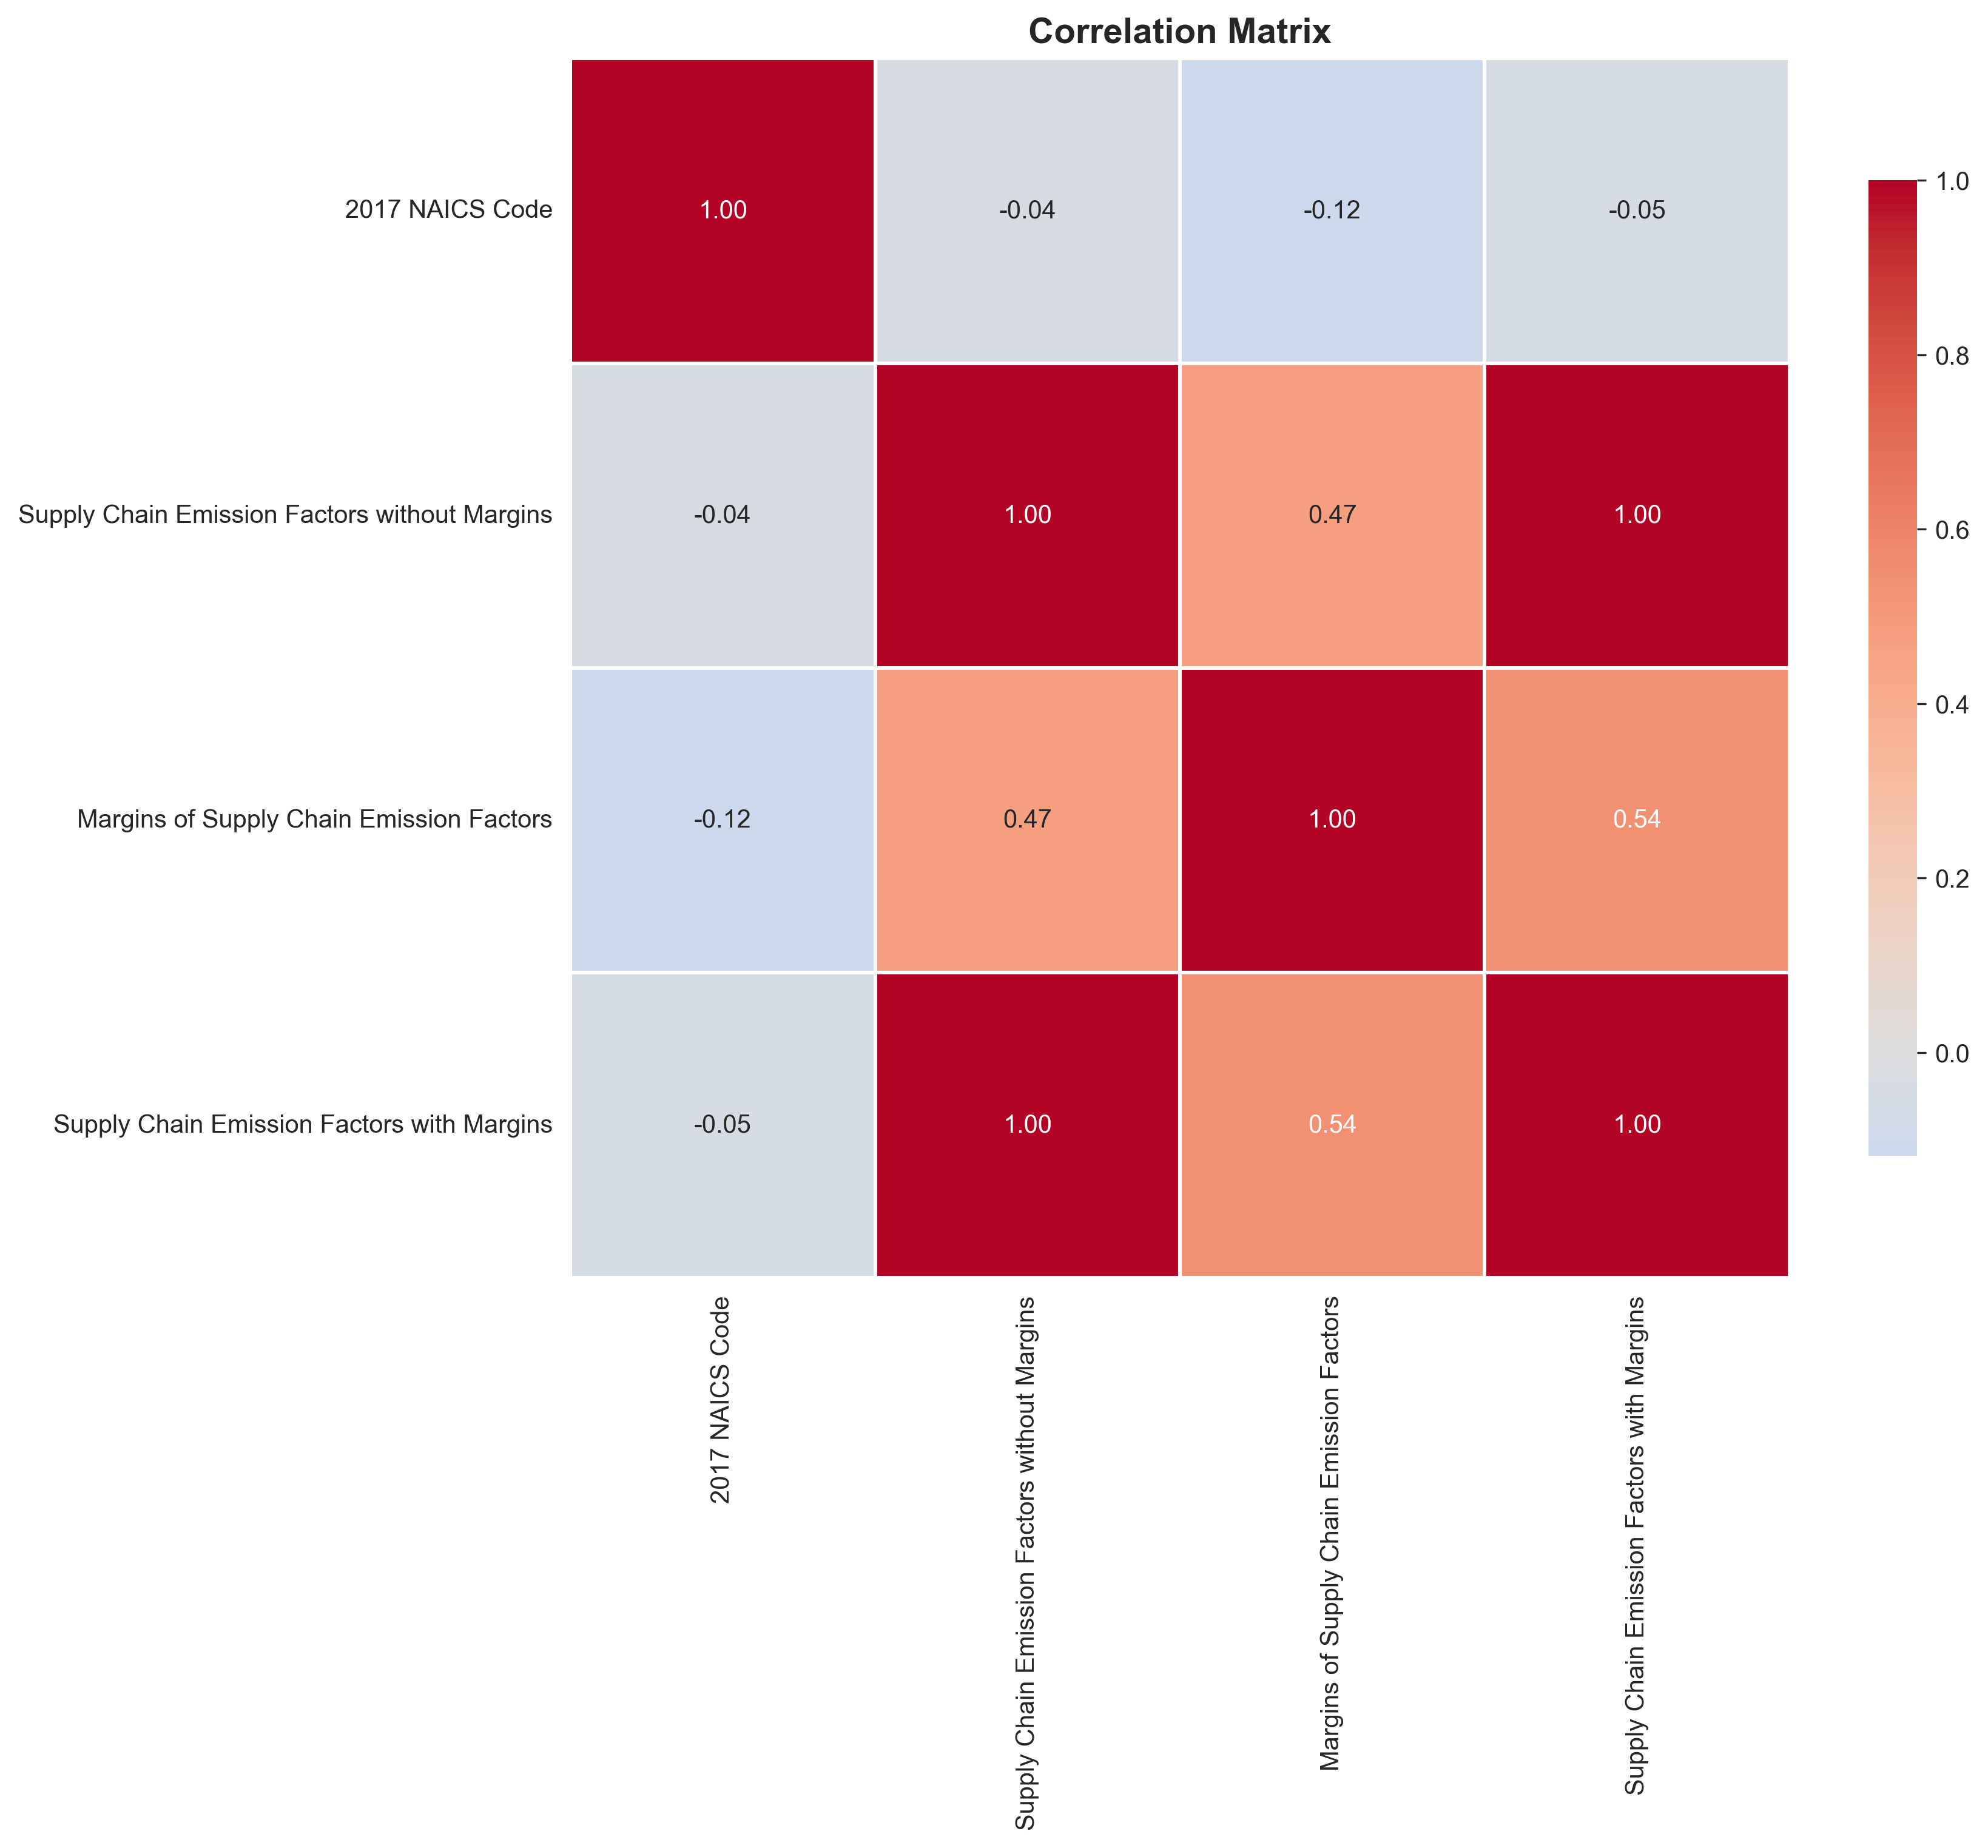
The current interface is a guided CLI that echoes pipeline progress, highlights validation warnings, and summarizes evaluation metrics. Visualization assets (heatmaps, distributions, scatter matrices, time series) are generated automatically to support publication-ready figures. These assets are saved with consistent naming conventions so a Streamlit or Ready Tensor front-end can embed them directly.
        for col in numeric_cols[:5]:
            try:
                plots[f'distribution_{col}'] = self.generate_distribution_plot(
                    df[col],
                    title=col,
                    output_path=output_dir / f"distribution_{col}.{settings.visualization_format}"
                )
            except Exception as e:
                print(f"Warning: Failed to generate distribution plot for {col}: {e}")
.png?Expires=1775187066&Key-Pair-Id=K2V2TN6YBJQHTG&Signature=ZKw3eOlByivCU4YUdP~N4uyAjVAmVquKVKMtHIp3btebsvPldHMdpcek29bwiscIB02Maz8pC9-o~Yx~qzOse4J~EHAFSLLclRKvZHHUeZVp13ac3kT~BE4O7N11Sbiqf3AGNQCQ-MqTDokiyif95~53DcOFaFG3jKMpkkr68eObD971ANTVcSpXfvIwLGm1pV-quyyDAAhs5QEV2xZH1YOb9zTvvUUcvNa1pU6tBthPhdX~w2JQx33q6auO1xuNREhB7ogTgrAW7k7QfP7~jIVqJF~u2I~UylevNRMGDQ5rmzkuaH1eH85baR-Oy0TxIXmrrcvYbq0YC6RN8rT8sQ__)
The pipeline is packaged as a Python application with a single entry point. Operators install dependencies via pip install -r requirements.txt, configure credentials in .env, and run python main.py --query "...". A feature flag toggles between LangGraph coordination and the legacy sequential fallback so teams can deploy in environments without LangGraph while retaining compatibility with orchestration-first setups.
1. Install dependencies: `pip install -r requirements.txt`
2. Set up `.env` file from `.env.example`
3. Run: `python main.py --dataset kaggle --dataset-name "username/dataset-name"`
Recent dry runs on U.S. renewable energy datasets demonstrate the end-to-end loop: the analyst highlights growth trends, the auditor confirms parity between claimed and computed statistics with a 0.95 confidence score, and the evaluator judges accuracy, clarity, soundness, and honesty between 8–9/10 while measuring 98% numeric accuracy. Each artifact is archived in the output/ directory for transparency and re-use.
**Analyst Agent:**
- Generates summary: "Renewable energy grew 18% between 2020–2023"
- Identifies: "Wind energy is the fastest-growing sector"
- Creates visualization: Year vs. Production chart
# ... existing code ...
**Evaluator Agent (LLM-as-Judge):**
- Rates analysis clarity (9/10), accuracy (9/10), soundness (8/10), honesty (9/10)
- Numeric accuracy: 98%
Open government analytics typically lean on ad-hoc spreadsheets or isolated BI dashboards, which seldom guarantee license compliance, numeric validation, or reproducible prompt histories. The Open Data Insight Generator closes that gap by encoding each analyst role as an auditable agent with typed state transitions, something absent in most tooling meant for Data.gov exploration.
        result = {
            "overall_valid": True,
            "confidence_score": 1.0,
            "statistical_checks": [],
            "numeric_checks": [],
            "errors": [],
            "warnings": [],
            "discrepancies": []
        }
        # ... existing code ...
        if result["errors"]:
            result["overall_valid"] = False
        return result
| Baseline | Strength | Gap Addressed by This Project |
|---|---|---|
| Manual Data.gov downloads | Direct access to authoritative datasets | No automated license verification, cleaning, or audit trail; this pipeline automates those steps via the Data Collector Guardrails. |
| Tableau / Power BI dashboards | Rich visualization tooling | Require pre-processed data and manual statistical validation; Analyst + Auditor Agents automate statistical checks and produce machine-readable reports. |
| CKAN-based CKAN Harvester scripts | Automated ingestion | Focus on metadata sync, not insight generation or validation; our multi-agent chain delivers insights, audits, and evaluation artifacts. |
| Single-agent LLM summarizers | Fast narrative generation | Often hallucinate or misstate figures; Evaluator + NumericValidator modules constrain narratives with numeric cross-checks. |
| Kaggle notebooks | Flexible analysis environment | Depend on expert intervention, lacking turnkey orchestration; LangGraph coordination provides reusable, query-driven workflows. |
        workflow.add_edge("data_collector", "analyst")
        workflow.add_edge("analyst", "auditor")
        workflow.add_edge("auditor", "evaluator")
        workflow.add_edge("evaluator", END)
NotImplementedError), so operators must supply explicit dataset names; extending fetch_by_query is a priority.NumericValidator may miss complex claims, potentially under-reporting discrepancies; augmenting it with structured parsing or semantic tagging would improve recall.elif source.lower() == "kaggle": # For Kaggle, would need to search - simplified for now raise NotImplementedError("Kaggle query search not yet implemented")
        if self.provider == LLMProvider.GROQ.value:
            if not settings.groq_api_key:
                raise ValueError("GROQ_API_KEY is required for Groq provider")
            self.client = Groq(api_key=settings.groq_api_key)
        elif self.provider == LLMProvider.OPENAI.value:
            if not settings.openai_api_key:
                raise ValueError("OPENAI_API_KEY is required for OpenAI provider")
            self.client = OpenAI(api_key=settings.openai_api_key)
        patterns = [
            (r'(?:mean|average|avg)[:\s]*([+-]?\d+\.?\d*)', 'mean'),
            (r'(?:std|standard deviation)[:\s]*([+-]?\d+\.?\d*)', 'std'),
            (r'(?:count|total)[:\s]*(\d+)', 'count'),
            (r'(\d+\.?\d*)%', 'percentage'),
        ]
        for pattern, claim_type in patterns:
            matches = re.finditer(pattern, text, re.IGNORECASE)
            # ... existing code ...
Analyze open data about U.S. renewable energy consumption from 2020 onward → Fetches DOE renewable production tables, produces growth-rate commentary, and exports heatmaps plus a 0.95-confidence audit report.Compare county-level vaccination rates with demographic indicators in California → Pulls CDC immunization datasets, highlights correlations between coverage and age brackets, and flags counties with data-quality warnings before publishing evaluator scores.What are the top safety incidents reported in public transit systems in 2023? → Aggregates Bureau of Transportation Statistics feeds, ranks incident categories, and attaches audited count totals ready for Ready Tensor dashboards.