We've all wondered where the stock market might be heading. While predicting the future with certainty is impossible, analyzing historical trends can offer valuable insights. Traditional stock analysis often involves complex tools or static charts, making it hard for enthusiasts to explore potential future scenarios interactively.
That's why I built the Indian Stock Forecast App—a web application using Streamlit that leverages the power of Facebook's Prophet forecasting model and Yahoo Finance data (yfinance) to visualize potential future trends for NIFTY 50 stocks. In this article, I'll walk you through how I built it, the key components, and the crucial considerations when using time series forecasting for financial data.
The goal wasn't to create a crystal ball for stock picking (an impossible task!), but rather to build an intuitive tool that allows users to:
Technologies Used:
The application flow is straightforward:
yhat, yhat_lower, yhat_upper).Let's examine some key code snippets:
1. Setting up the Interface and Stock Selection (Streamlit)
Streamlit makes creating the UI incredibly simple. We define a dictionary of stock names and their Yahoo Finance tickers, then use st.sidebar.selectbox to let the user choose.
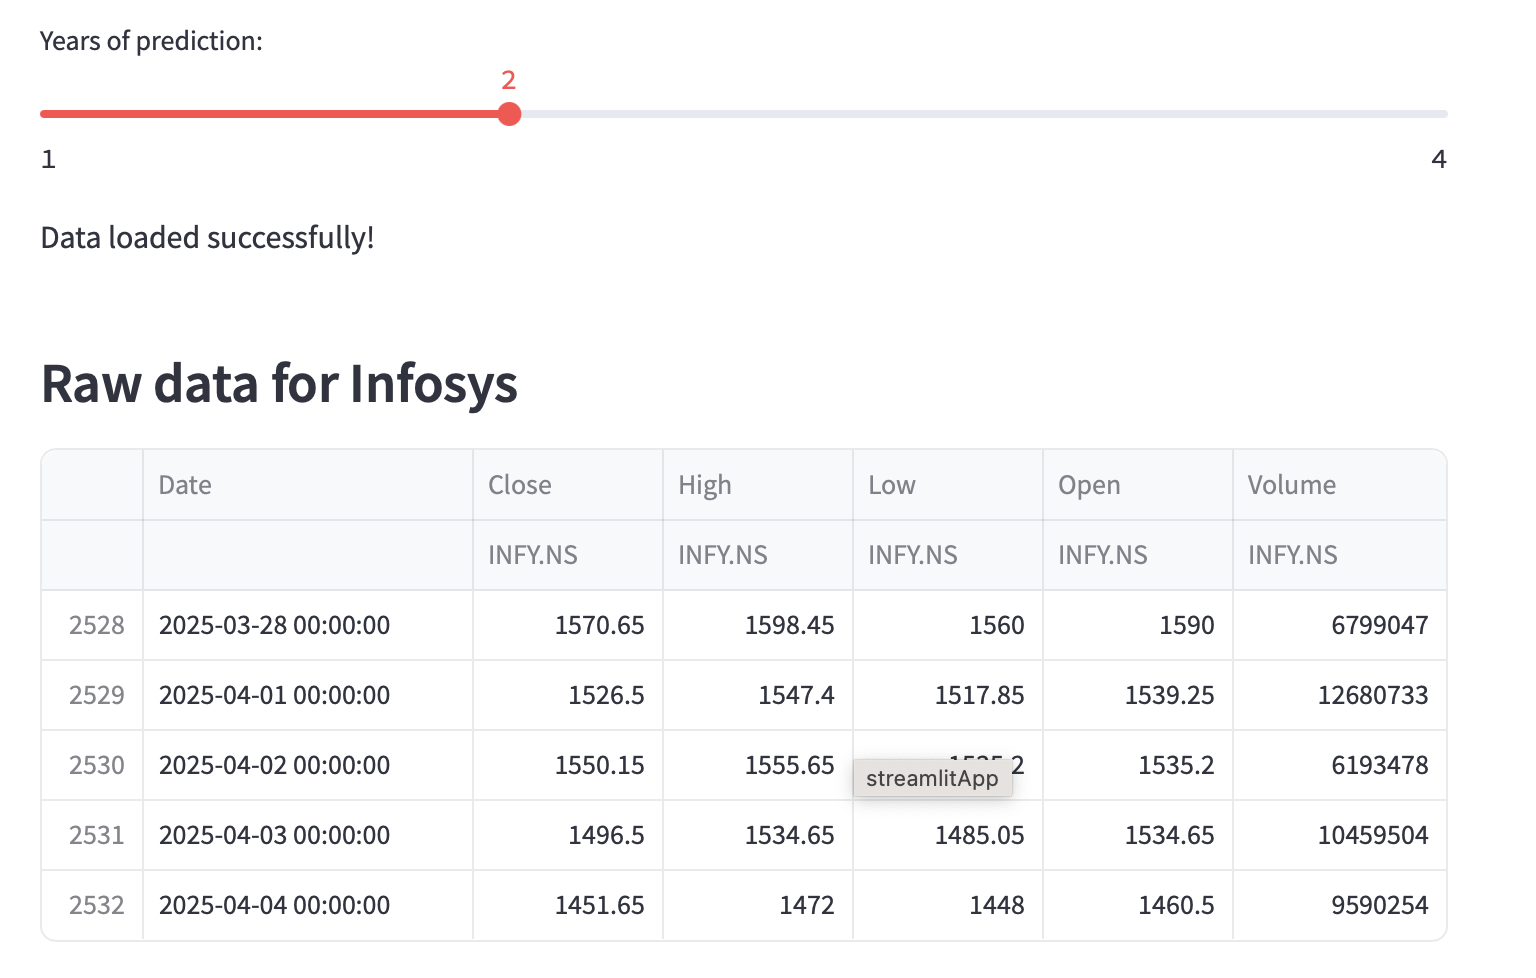
import streamlit as st
from datetime import date
import yfinance as yf

# Define NIFTY 50 stock tickers
nifty_50_stocks = {
    'Reliance Industries': 'RELIANCE.NS',
    'Tata Consultancy Services': 'TCS.NS',
    # ... (rest of the stocks) ...
    'HDFC Life Insurance': 'HDFCLIFE.NS'
}

st.title('Indian Stock Forecast App')

# Add a sidebar for NIFTY 50 stock selection
selected_stock = st.sidebar.selectbox(
    'Select a NIFTY 50 stock for prediction',
    list(nifty_50_stocks.keys())
)
ticker = nifty_50_stocks[selected_stock]

n_years = st.slider('Years of prediction:', 1, 4)
period = n_years * 365
We use yfinance to download the data and @st.cache_data to cache the results, preventing redundant downloads when the user changes only the forecast period.
START = "2015-01-01"
TODAY = date.today().strftime("%Y-%m-%d")

@st.cache_data
def load_data(ticker):
    data = yf.download(ticker, START, TODAY)
    data.reset_index(inplace=True)
    return data

data_load_state = st.text('Loading data...')
data = load_data(ticker)
data_load_state.text(f'Data for {selected_stock} loaded successfully!')
The core forecasting logic involves preparing the data (renaming columns to ds and y as required by Prophet), initializing the model, fitting it to the historical data, creating a future dataframe, and making the prediction.
from prophet import Prophet
from prophet.plot import plot_plotly

# Prepare data for Prophet
df_train = data[['Date','Close']]
df_train = df_train.rename(columns={"Date": "ds", "Close": "y"})

# Initialize and fit the model
m = Prophet()
m.fit(df_train)

# Create future dataframe and predict
future = m.make_future_dataframe(periods=period)
forecast = m.predict(future)

# Display forecast plot
st.subheader(f'Forecast plot for {n_years} years')
fig1 = plot_plotly(m, forecast)
# Optional: Customize plot colors here if needed
st.plotly_chart(fig1)

# Display components plot
st.write("Forecast components")
fig2 = m.plot_components(forecast)
st.write(fig2)
While Prophet is powerful for many time series tasks, forecasting stock prices is notoriously difficult. This was less a "challenge during development" and more a "fundamental challenge of the problem domain." It's crucial to understand why:
Market Complexity: Stock prices are driven by countless factors beyond past prices – news, earnings reports, economic indicators, global events, and investor sentiment. Simple time series models struggle to capture this complexity.
Non-Linearity & Randomness: Markets often behave non-linearly and are subject to sudden shocks or events (the infamous "black swans") that historical patterns cannot predict.
Efficient Market Hypothesis (EMH): A core financial theory suggests that current prices already reflect all available information, making purely historical analysis insufficient for gaining an edge.
Model Assumptions: Prophet, like many time series models, makes assumptions (e.g., additive effects of trend and seasonality) that might not perfectly hold true for volatile stock data.
Because of these limitations, I included a prominent note directly in the app:
# (Inside the Streamlit app code)
st.subheader("Important Note")
st.write("""
**This forecast model is based on Time Series Models... These models... rely heavily on historical data...**

**Limitations in Predicting Stock Market Prices:**
**Complexity of Market Dynamics:** ...
**Assumption of Linearity:** ...
**Over-reliance on Historical Data:** ...
**Ignoring External Factors:** ...
**Market Efficiency:** ...

**Why One Should Not Rely Solely on Forecast Models:**
Relying solely on these models for predicting stock prices is risky. Fundamental analysis provides a more comprehensive view a balanced approach is essential.
""")
This transparency is important. The app is a tool for visualizing potential trends based on past data, not a guaranteed prediction machine.
Want to explore stock trends yourself?
Set up your environment:
pip install streamlit prophet yfinance plotly pandas
Get the code: You can find the complete code on my GitHub: https://github.com/vikramlingam/Stock_Forecast
Run the application:
streamlit run your_script_name.py
This project serves as a solid foundation. Future ideas include:
1. Adding Technical Indicators: Incorporating moving averages, RSI, MACD, etc.
2. Comparing Models: Allowing users to compare Prophet forecasts with other models like ARIMA.
3. Fundamental Data Integration: Pulling in basic financial ratios or news sentiment (though this significantly increases complexity).
4. Volatility Analysis: Visualizing historical and potentially forecasted volatility.
Building this Indian Stock Forecast App was a great exercise in combining data fetching, time series modeling, and interactive web development. Streamlit makes it remarkably easy to turn a Python script into a usable tool, while Prophet provides sophisticated forecasting capabilities.
However, the most important takeaway is the responsible use of such tools. While visualizing potential trends based on historical data is insightful, it's crucial to remember the inherent limitations of forecasting complex systems like the stock market. This app should be seen as an educational tool for exploring patterns, not as financial advice. Always combine such analysis with fundamental research and a sound investment strategy.