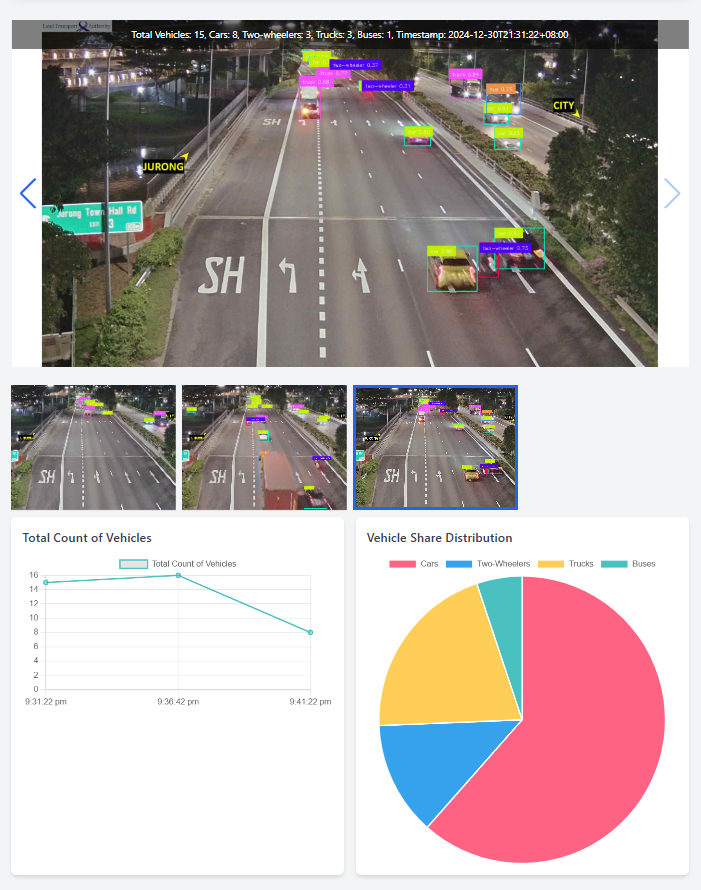
This project focuses on the development of a real-time traffic monitoring system for Singapore, utilizing cutting-edge machine learning techniques to detect and analyze traffic conditions. By integrating live data from government APIs, a dynamic dashboard was created to display real-time traffic information. The system employs the YOLOv11 model from RoboFlow to detect and classify various vehicle types, including cars, trucks, buses, and two-wheelers.
To enhance the model's performance, multiple RoboFlow datasets were combined to create a comprehensive dataset capable of accurately detecting and categorizing vehicles. A time-series dataset was generated by performing inference on a single camera feed, using vehicle count and occupation ratio as primary features. Anomaly detection was then applied using Z-score analysis to identify unusual traffic patterns, such as traffic jams. This approach demonstrates an effective solution for real-time traffic monitoring and congestion detection, offering valuable insights to optimize traffic flow and enhance urban mobility.
Urban traffic congestion is a growing global challenge, requiring efficient real-time solutions to manage traffic flow and enhance safety. Traditional traffic monitoring systems often fall short in scalability and real-time responsiveness. This project introduces a flexible and scalable framework for real-time vehicle monitoring, designed to be deployed in cities worldwide. The framework leverages advanced machine learning and computer vision technologies, including the YOLOv11 model for accurate vehicle detection and classification, and anomaly detection using time-series data to identify traffic disruptions like jams.
As a case study, Singapore's traffic data is utilized to demonstrate the effectiveness of this framework. By integrating publicly available government traffic APIs with real-time vehicle detection, the system provides insights into traffic patterns and enables proactive responses to congestion. The framework can be adapted to different urban environments, offering a cost-effective solution for global traffic management that enhances operational efficiency and safety.
This section describes the processes followed to obtain a vehicle detection and classification model.
To begin with, it is essential to explore the characteristics of the data before proceeding with any further analysis or model development. For this project, we utilized web scraping to gather both images and their associated metadata from the various traffic cameras installed across Singapore, which are publicly available on government websites.
After scraping the data, the following key observations were made:

Upon reviewing a subset of the camera images, the following observations were made:
Varying Camera Angles and Lighting Conditions: Images captured from different locations show diverse perspectives due to varying camera angles. Lighting conditions also differ, especially between day and night.
Interference from Light Sources: Nighttime images exhibit interference from artificial light sources such as street lights, which may cause glare and affect the clarity of vehicle detection.
Motion Blur: Some images contain motion blur, likely due to fast-moving vehicles, making it difficult to clearly identify vehicles in the frame.
Visibility of Vehicles: In certain images, vehicles are barely visible due to poor lighting or camera positioning, adding another layer of complexity to the analysis.
Obstructions in the Frame: There are instances where objects like trees or other structures obstruct the view of vehicles, further complicating the vehicle detection process.
These observations highlight the challenges involved in using traffic camera images for vehicle detection and traffic analysis, emphasizing the need for robust image processing and machine learning techniques to handle such inconsistencies and variabilities in the data.
To obtain suitable annotated data for vehicle detection, several traffic image datasets of Singapore were sourced from Roboflow Universe. The following steps were performed to prepare the data:
Dataset Merging: Five datasets containing annotated traffic images with detection boxes for vehicles were combined to create a comprehensive dataset.
Class Remapping: Due to inconsistent labeling across the datasets, the Class Remapping feature of Roboflow was used to standardize the vehicle categories into four consistent classes: car, two-wheeler, truck, and bus.
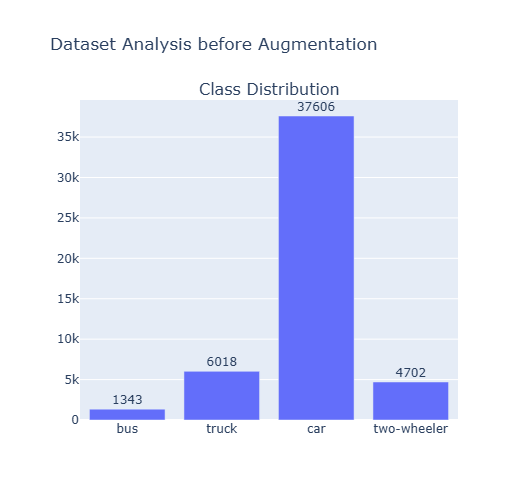
The above bar graph shows the class distribution of dataset before data preprocessing.
Given the limited number of available images, data augmentation was employed to enhance the diversity of the training dataset and improve the robustness of the model to varying image conditions. The following transformations were applied to the images:
Grayscale: 12% of the images were converted to grayscale to simulate lighting variations and reduce the model’s reliance on color features.
Brightness Adjustment: A random adjustment of brightness in the range of -15% to 15% was applied to introduce variability in lighting conditions across the dataset.
Exposure Adjustment: The exposure levels of the images were randomly modified within a range of -10 to 10% to simulate different lighting environments, such as daytime and nighttime conditions.
Blur: A blur effect with a maximum radius of 1.1 pixels was applied to some images to replicate the presence of motion blur and ensure the model could handle less-than-ideal image quality.
These preprocessing steps were designed to increase the variability of the training set, thereby enhancing the model's ability to generalize and perform well under different environmental conditions and image qualities.
YOLOv11 was selected for vehicle detection in this project due to its real-time performance, high accuracy, and flexibility. YOLOv11 excels at detecting small and overlapping objects, making it ideal for crowded traffic scenes. Its ability to be fine-tuned for specific vehicle classes (e.g., cars, trucks, buses, two-wheelers) and its scalability to handle varying image sizes further justified its use.

After data augmentation and preprocessing, most images were allocated to the training set to enhance model generalization. The test set was handpicked to ensure diversity in vehicle types, lighting, and camera angles, providing a comprehensive evaluation of the model's performance.
The YOLOv11 model was initialized with pre-trained weights from the COCO dataset and fine-tuned on our traffic dataset. Training results showed that the model achieved a mean Average Precision (mAP) of 63% on the validation set. The loss curves for box loss, class loss, and object loss were also tracked, reflecting the model’s progress in accurately predicting bounding boxes, classifying vehicles, and detecting objects.
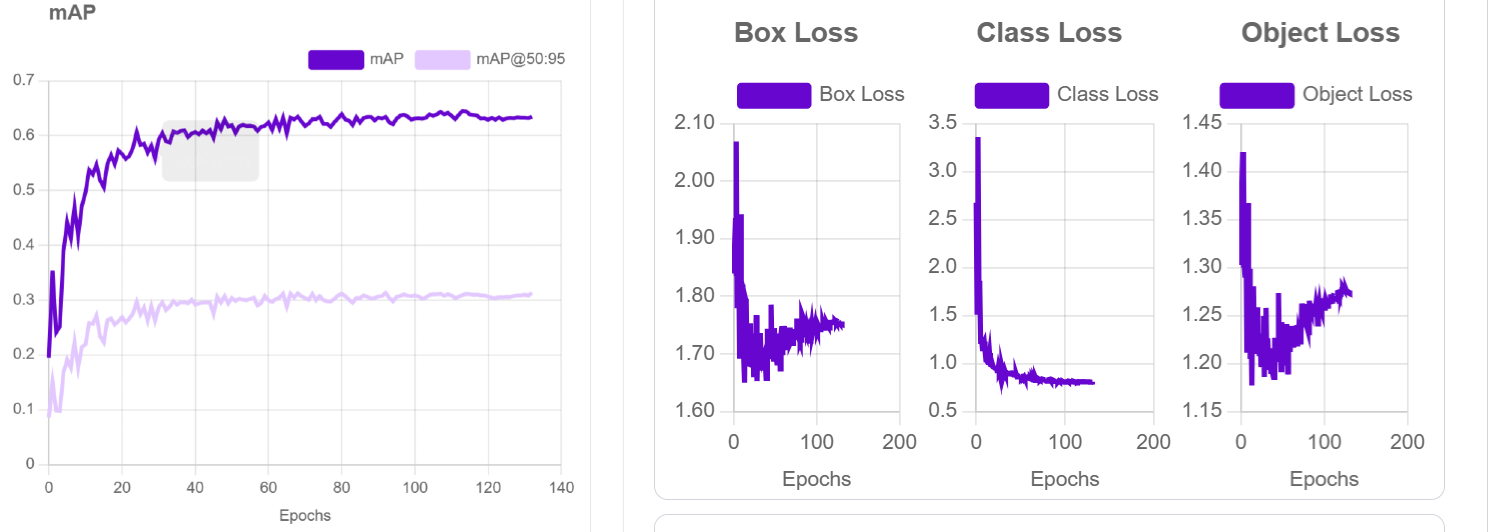

The performance of the YOLOv11 model was evaluated on the test set, achieving a mean Average Precision (mAP) of 63.7%, as illustrated. This indicates that the model demonstrates reasonable effectiveness in detecting and classifying vehicles in diverse traffic conditions.
To optimize the model's performance in real-world conditions, hyperparameters were fine-tuned based on the analysis of live traffic images from the dashboard. Specifically, the confidence threshold was set to 0.3 and the overlap value (IoU threshold) was adjusted to 0.5. A lower confidence threshold was selected to mitigate false negatives, as higher confidence levels led to missed detections in certain scenarios, such as challenging lighting conditions or obstructions. This balance ensured improved detection rates while maintaining precision in crowded and dynamic environments.
In this section, the methodology utilized to detect traffic jams on a selected road using traffic detection and classification is described. The process involves data collection, image preprocessing, vehicle detection, feature extraction, and anomaly detection to identify significant traffic events.
For this experiment, a specific traffic camera from the Singapore government’s publicly available api was selected. Images were collected from the camera at 5-minute intervals over a one-week period through the government’s API.

To focus on the relevant section of the road, a mask was applied to each image, segmenting only one side of the road. This masked region was retained for further analysis, ensuring that only the desired road segment was considered in the traffic analysis.
The count of each vehicle type was recorded for each image using model inference through model API endpoint. Additionally, the occupation ratio for each image was computed, which is defined as the ratio of the union of all detection boxes to the total segmented area (after masking the road). This ratio represents the proportion of the road occupied by vehicles.
The detected vehicles and classification results were compiled into a time series dataset containing the following features:
This time series dataset formed the basis for the analysis of traffic anomalies.
Anomaly detection was performed using the Z-score method, which measures how many standard deviations a data point deviates from the mean. The Z-score for a given data point
Where:
Anomalies are identified when the absolute value of the Z-score exceeds a predefined threshold
The anomaly detection process identified significant deviations in both Total Vehicles and Occupation Ratio across several time window of 15 minutes. These deviations were flagged as high traffic anomalies, indicative of potential traffic jams or congestion events.
This approach utilizes both the Total Vehicles and Occupation Ratio to identify anomalies, as both features are critical for detecting traffic congestion. The Total Vehicles feature provides information on the volume of traffic, while the Occupation Ratio reflects the extent of road occupancy. By considering both features together, the method ensures that anomalies are detected only when both the volume of traffic and the level of road occupancy exceed normal conditions. This combined approach helps to better capture scenarios where both high traffic volume and high occupancy indicate potential traffic jams, thus providing a more accurate and reliable anomaly detection.
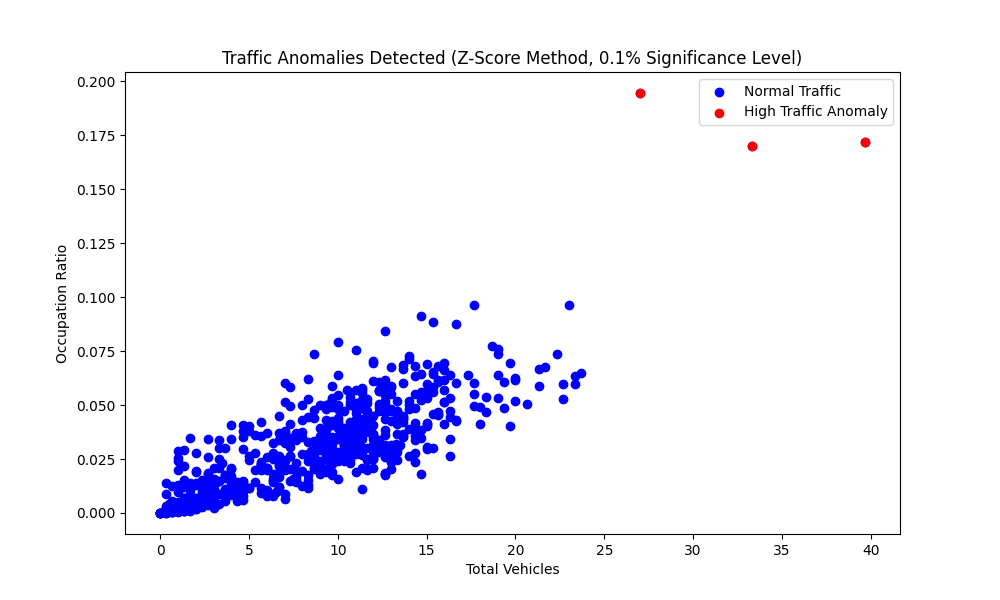
A scatter plot of Total Vehicles versus Occupation Ratio was generated to visually represent the detected anomalies. Data points representing normal traffic conditions were depicted in blue, while the high traffic anomalies were highlighted in red.
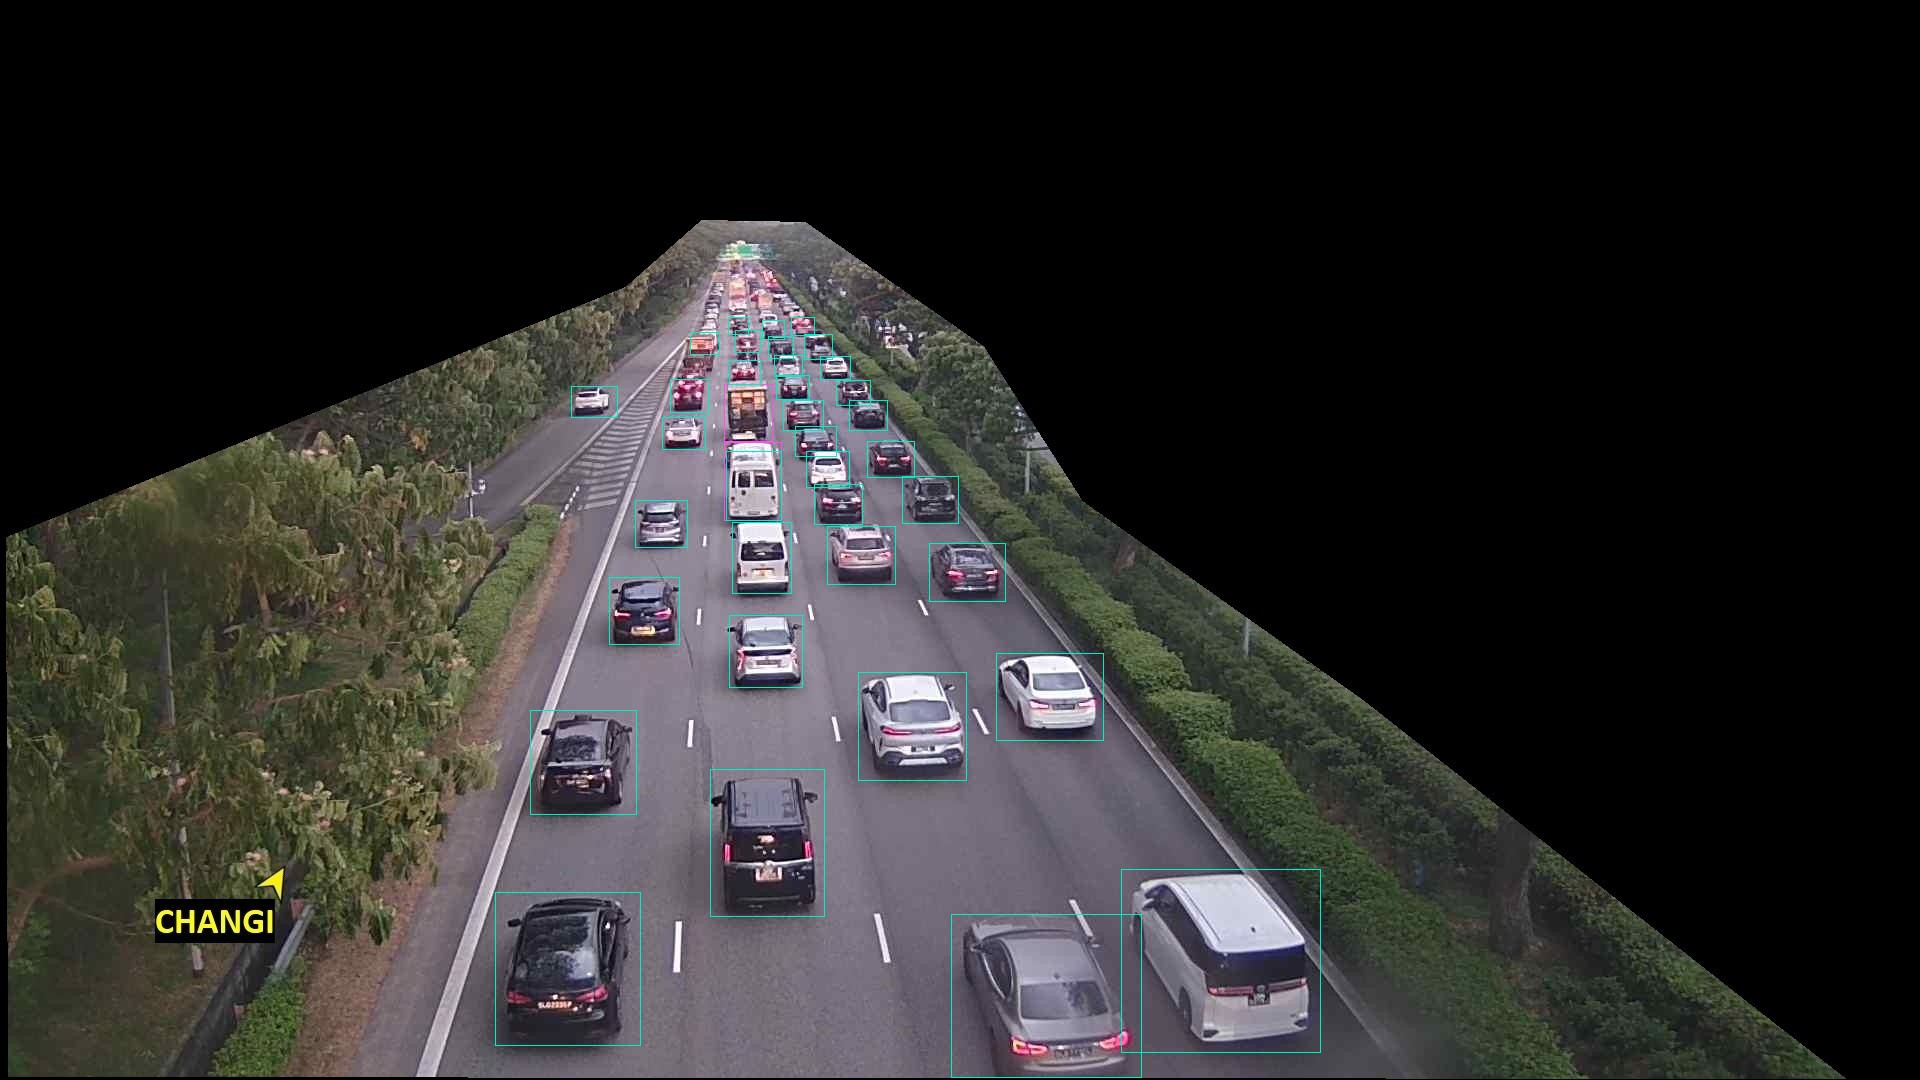
The image above depicts a potential traffic jam observed during the time window from 18
to 19 on December 11, 2024. During this period, the mean number of vehicles detected was 40, with an average occupation ratio of 0.17.This work presents a scalable traffic monitoring framework that automatically detects, classifies, and identifies traffic congestion using computer vision. By processing traffic camera feeds, the system classifies vehicles and assesses road occupancy, enabling traffic jam detection without the need for manual labeling. A real-time dashboard displays live images and traffic data from Singapore’s cameras, offering an intuitive interface for monitoring traffic conditions.
While demonstrated with Singapore data, this framework is adaptable to other urban settings, providing valuable insights for traffic management and urban planning.
The code for the project can be referenced using this colab notebook.
The github repo for the traffic jam detection : https://github.com/BlazeStorm001/singvms-anomaly
The github repo for the website dashboard : https://github.com/BlazeStorm001/singvms
Thanks to the Roboflow users "fyp car dataset", "Singapore", "is3107", "Traffic Dataset" for making the datasets for Singapore Traffic available on the Roboflow Universe.