
This publication focuses on the classification of fear emotions using EEG signals and machine learning techniques. The study explores how different levels of fear can be distinguished based on power variations across various EEG frequency bands (Alpha, Beta, Theta, Delta, Gamma) using eight specific electrodes. An experiment involving seven participants was conducted, where their brain activity was recorded while they watched horror clips, and their fear levels were ranked. The EEG signals were processed, cleaned using ICA, and the power of each frequency band was calculated. Statistical tests, such as repeated measures ANOVA and post hoc tests, revealed significant differences in brain activity based on fear levels.
These insights were then used to train machine learning models (SVM, KNN and Simple ANN) to classify fear emotions into binary classes. Among the models, a simple ANN model achieved the highest accuracy of 89%, surpassing SVM and KNN classifiers. The results of the study suggest that EEG signals can effectively reflect changes in fear intensity, particularly in the frontal lobe regions, but highlight the need for further exploration with a larger sample size and additional data refinement.
This work contributes to the growing body of research on emotion recognition through brain-computer interfaces, emphasizing the potential of EEG-based systems in enhancing human-computer interaction by integrating emotion detection capabilities.
Imagine a world where technology not only responds to our commands but understands how we feel—where your computer can sense your frustration as you struggle with a task or detect your excitement when you discover something new. This is the vision behind emotion recognition in Human-Computer Interaction (HCI), and it is nothing short of revolutionary.
Human emotions are the core of our interactions. Whether we’re engaging with other people or with machines, emotions dictate our decisions, drive our actions, and shape our experiences. Yet, computers—our most powerful tools—remain emotionally oblivious. They follow instructions with precision, but with no sense of context or empathy. This disconnect leaves a gap in how effectively we interact with technology.
That’s where emotion detection, particularly through brain signals like EEG, becomes a game changer. By analyzing subtle changes in our brainwaves, we can teach machines to recognize emotional states, like fear, excitement, or frustration. In environments where user experience is key, such as education, mental health, gaming, or customer service, this ability can create deeply personalized and adaptive systems. Imagine a tutor that senses when a student feels overwhelmed and adjusts its teaching style or a health app that monitors stress levels to offer calming activities when needed most.
At the heart of this project lies a specific challenge: fear. Fear is a powerful emotion—one that triggers profound changes in our brain activity. By training machines to recognize varying levels of fear, we unlock the potential to create systems that can respond dynamically to high-stress situations. For instance, imagine an AI-driven training program for firefighters that adapts based on their stress levels, ensuring they are mentally prepared for high-pressure environments.
But this isn’t just about understanding fear; it’s about teaching machines to be more human. By embedding empathy into our technological systems, we open the door to a future where machines don’t just serve us—they support us emotionally, making our interactions with them more intuitive, responsive, and human-centered.
In essence, this project isn’t just about classifying fear; it’s about transforming the way we interact with the world through technology, creating a future where emotions aren’t just understood by humans, but also by the machines that serve us. The impact of such a breakthrough in HCI could be transformative, bridging the emotional gap between man and machine.
This project aims to classify fear emotion into three distinct intensity levels using EEG signals. By analyzing the power of EEG signals across different frequency bands and electrodes, the goal is to identify which brain regions are most affected by varying levels of fear and develop machine learning models capable of accurately classifying these intensities. The research addresses the challenge of detecting emotional states in real-time to enhance human-computer interaction, particularly in stress-inducing scenarios.
Emotion recognition using EEG signals has been widely studied, as emotions are integral to human interactions and can be detected through brainwave patterns. One of the foundational models in emotion classification is Russell’s 2D model of affect, which categorizes emotions along two dimensions: arousal (ranging from calm to excited) and valence (ranging from pleasant to unpleasant). According to this model, each emotion occupies a unique position based on its combination of arousal and valence. For instance, fear is characterized by high arousal and low valence.
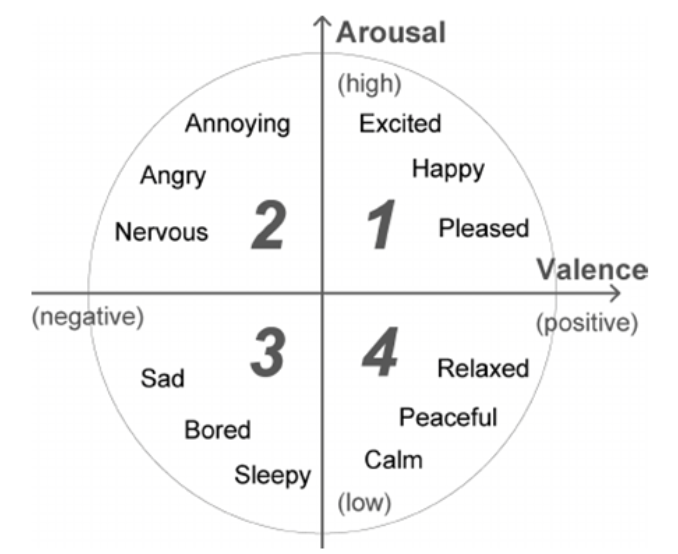
Figure 1: Russell’s 2D model for emotion classification
Expanding upon this, researchers like Harsh Dabas et al. have introduced a 3D model, which incorporates dominance alongside arousal and valence. This additional dimension captures the intensity of control or power the emotion exerts, making it a more nuanced approach to emotion classification. Both models serve as a basis for understanding how emotions like fear can be mapped through brain signals, with EEG data reflecting changes across these dimensions.
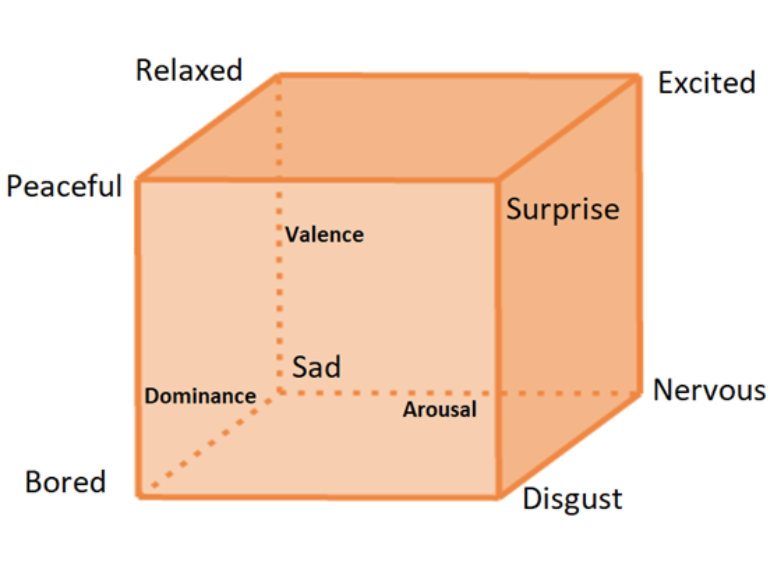
Figure 2: 3D model for emotion classification
An electroencephalogram (EEG) records electrical activity in the brain, typically measured in microvolts. EEG signals are divided into five frequency bands—Gamma, Beta, Alpha, Theta, and Delta—each associated with different mental states. Gamma relates to higher mental activity, Beta to active thinking, Alpha to relaxation, Theta to deep meditation, and Delta to dreamless sleep. EEG signals are captured using multiple scalp electrodes, ranging from 1 to 1024, with more electrodes providing more brain activity information. Key features extracted from EEG include temporal (changes over time), spectral (power in frequency bands), and spatial (origin within the brain). However, EEG signals can be disrupted by factors like muscle movement and eye blinking, which require preprocessing to clean the data.
| Frequency | Associated With |
|---|---|
| Gamma (Above 30 Hz) | Higher Mental Activity, Consciousness, Perception |
| Beta (13-30 Hz) | Active Thinking, Concentration, Cognition |
| Alpha (7-13 Hz) | Relaxation(while awake), Pre-sleep Drowsiness |
| Theta(4-7 Hz) | Dreams, Deep Meditation, REM sleep, Creativity |
| Delta (Below 4 Hz) | Deep Dreamless Sleep, Loss of Body Awareness |
In EEG studies, electrodes are placed at specific locations on the scalp to capture electrical activity in different regions of the brain. These placements follow standardized systems, such as the 10-20 system, which is used to ensure consistency across studies. The names of the electrodes reflect both their position on the scalp and the brain region they monitor.
The electrodes are positioned based on anatomical landmarks, such as the nasion (the bridge of the nose) and the inion (the bump at the back of the skull), ensuring they cover key areas of the brain. Each electrode label provides specific information about its location:
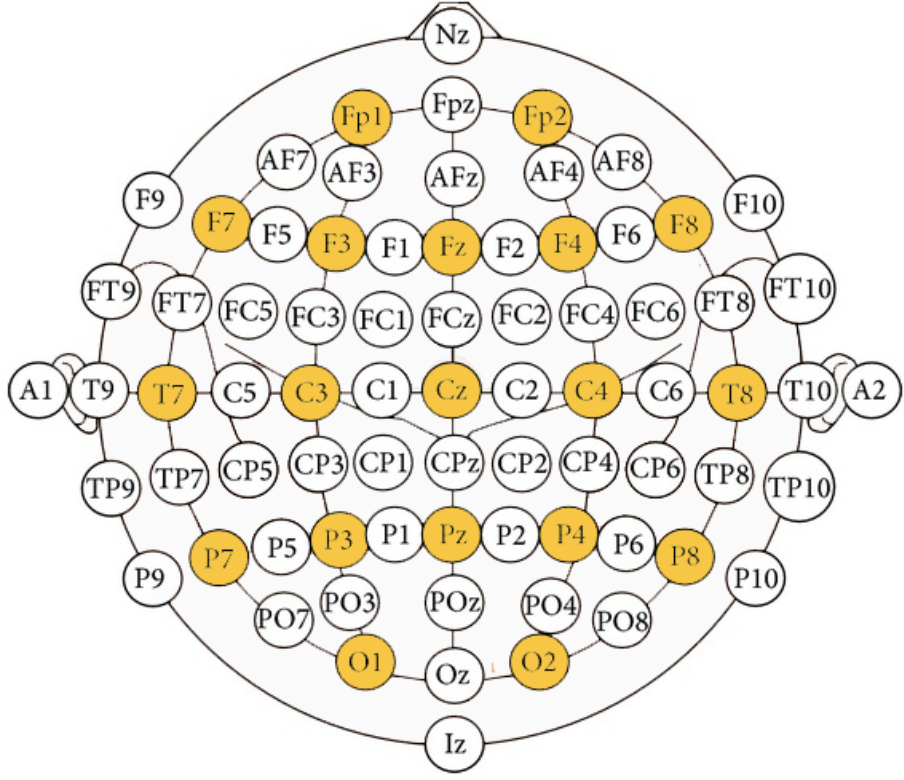
These electrodes were selected to capture activity from regions of the brain directly involved in both emotional and cognitive processes, making them ideal for studying fear intensity. By analyzing data from these placements, the research aims to identify how specific brain regions contribute to the experience and regulation of fear during the experiment.
This section details the experimental setup, methodology, and data processing pipeline used to investigate the relationship between fear intensity and brain activity, as captured by EEG signals. The experiment was carefully designed to elicit varying levels of fear in participants while ensuring the collection of high-quality EEG data. The subsequent data analysis and machine learning model development are also explained.
The primary objective of this research is to determine whether varying intensities of fear can be detected through EEG signals and classified into distinct levels. The research seeks to answer the following questions:
The strategy to address these questions involved exposing participants to controlled fear stimuli and recording their brain activity using EEG. To generate fear responses, three carefully selected horror videos were presented to the participants. Each video was chosen to induce a different intensity of fear: low, moderate, and high. The participants’ brain activity was measured during the video sessions, followed by self-reported assessments of their emotional experience.
The EEG signals were analyzed to identify significant differences between fear intensities, which were subsequently used to train machine learning models for classification purposes.
It is hypothesized that:
The experiment consisted of five key phases, each carefully designed to ensure the accuracy and consistency of the EEG recordings.
Preparation Phase
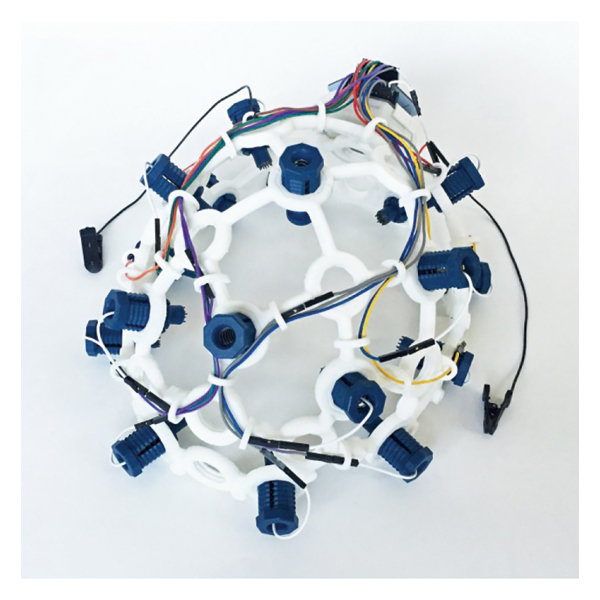
Participants were seated in a quiet, controlled environment to minimize external stimuli. The OpenBCI Ultracortex Mark IV headset was then positioned on their heads, ensuring that all electrodes made solid contact with the scalp to reduce signal noise. The eight electrodes selected for this experiment (Fp1, Fp2, F4, F7, P3, P4, P7, and P8) were strategically placed to capture brain activity associated with emotional responses, especially in the frontal and parietal lobes.
Video Presentation Phase
The participants were shown three pre-selected horror videos, each lasting for a few minutes and designed to trigger varying levels of fear. After each video, participants were asked to self-assess their emotional response, rating the level of fear on a scale from 0 (neutral) to 3 (very intense). This subjective feedback was essential for correlating self-reported fear levels with EEG signal data.
Break Phase
To prevent emotional carryover effects, participants took a short break (2-3 minutes) between each video. During this break, they were asked to relax and return to a neutral emotional state before continuing with the next video. This phase ensured that each video was evaluated independently without emotional bias from the preceding clip.
Post-Video Feedback
Immediately after watching each video, participants provided verbal feedback on their emotional experiences. This feedback was used to identify specific moments in the videos that elicited the strongest fear responses. These time points were critical for pinpointing segments of EEG data for detailed analysis
The experiment involved a total of 7 participants, consisting of 3 males and 4 females, all of whom were volunteers from different faculties at the German University in Cairo. Due to the complexity of the experiment and the need for high-quality EEG recordings, the sample size was limited to ensure manageable data collection and processing. All participants were fully briefed on the experimental procedure before the start of the study. Each participant underwent the same experimental procedure under consistent conditions. They were instructed to limit physical movement during the videos to minimize EEG signal contamination from muscle activity. The OpenBCI headset was adjusted for each participant to ensure accurate electrode placement. Following each video, participants were asked to recall specific moments that triggered the most fear, which helped in selecting key EEG data segments for analysis.
The raw EEG data was recorded using OpenBCI Ultracortex Mark IV headset shown below. The headset allows up to 19 electrodes from which 8 electrodes were chosen and these electrodes are (Fp1, Fp2, F4, F7, P3, P4, P7 and P8)
EEGLAB is an open-source MATLAB toolbox widely used for preprocessing and analyzing EEG data. It offers tools for cleaning, filtering, and removing artifacts from raw EEG signals, as well as performing advanced analyses like Independent Component Analysis (ICA) and time-frequency decomposition. In this study, EEGLAB was used to preprocess the raw EEG data, preparing it for further analysis and machine learning modeling.
The following steps outline the preprocessing pipeline applied:
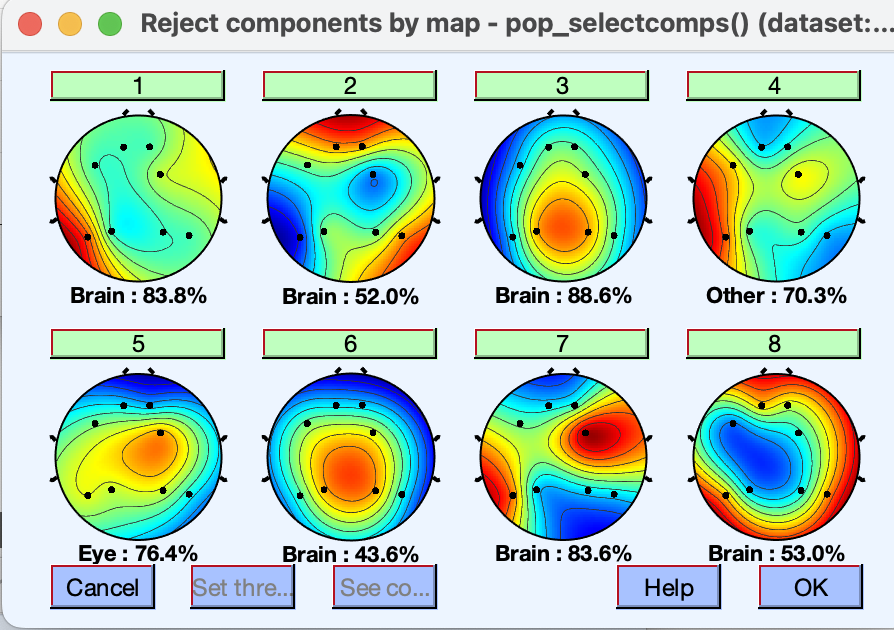
4. Epoch Extraction: Three epochs, each lasting two seconds, were extracted from the moments identified by participants as the most fear-inducing. These epochs provided key time windows for comparing brain activity across different fear intensities.
5. Wavelet Decomposition: The cleaned EEG signals were decomposed into their corresponding frequency bands (Delta, Theta, Alpha, Beta, and Gamma) using wavelet analysis. The power of each band was calculated for the selected epochs and log-transformed to normalize the data distribution.
A repeated measures ANOVA was conducted to examine whether significant differences existed in EEG signal power across the three levels of fear intensity (low, medium, high). This statistical test was chosen because it compares the same participants under different conditions, controlling for individual variability. The analysis was performed for each electrode and frequency band (Alpha, Beta, Theta, Delta, and Gamma), identifying which combinations showed significant changes in brain activity in response to varying fear levels.
Where the assumption of sphericity was violated, the Greenhouse-Geisser correction was applied to adjust the degrees of freedom and ensure accurate p-values. The results revealed significant differences in EEG signal power, particularly in the Alpha, Theta, and Delta bands, for specific electrodes such as Fp2 and F7, indicating their sensitivity to changes in fear intensity. These findings provided critical insights for feature selection in subsequent machine learning model development.
Blow is a table of P-Values for each of the bands:
| Electrode | Alpha | Beta | Theta | Delta | Gamma |
|---|---|---|---|---|---|
| Fp1 | 0.341 | 0.919 | 0.346 | 0.237 | 0.971 |
| Fp2 | <0.001 * | 0.018 * | <0.001 * | <0.001 * | 0.130 |
| F4 | 0.078 | 0.714 | 0.007 * | 0.006 * | 0.725 |
| F7 | <0.001 * | 0.252 | 0.003 * | <0.001 * | 0.155 |
| P3 | 0.474 | 0.355 | 0.310 | 0.327 | 0.924 |
| P4 | 0.710 | 0.761 | 0.800 | 0.316 | 0.870 |
| P7 | 0.298 | 0.126 | 0.573 | 0.102 | 0.461 |
| P8 | 0.325 | 0.409 | 0.319 | 0.244 | 0.533 |
Following the repeated measures ANOVA, post-hoc tests were conducted to identify the specific differences between pairs of fear intensity levels for each electrode and frequency band that showed significant effects. This additional analysis helps determine which pairs of fear levels (low, medium, high) demonstrate statistically significant differences in EEG signal power.
| Frequency Band | Low vs Medium | Low vs High | Medium vs High |
|---|---|---|---|
| Alpha | <0.001* | 0.023* | 0.074 |
| Beta | 0.011* | 0.012* | 0.624 |
| Theta | <0.001* | 0.112 | 0.064 |
| Delta | <0.001* | 0.362 | 0.005* |
| Frequency Band | Low vs Medium | Low vs High | Medium vs High |
|---|---|---|---|
| Alpha | <0.001* | 0.730 | 0.003* |
| Theta | <0.001* | 0.618 | 0.003* |
| Delta | <0.001* | 0.581 | <0.001* |
| Frequency Band | Low vs Medium | Low vs High | Medium vs High |
|---|---|---|---|
| Theta | 0.318 | 0.031* | 0.011* |
| Delta | 0.263 | 0.025* | 0.007* |
Based on the results of the post-hoc tests, it was observed that significant differences in EEG signal power occurred only between certain pairs of fear intensity levels. Therefore, the machine learning models were designed as binary classifiers to distinguish between the first and second levels of fear intensity. The models compared in this study include two versions of Support Vector Machine (SVM), K-Nearest Neighbors (KNN), and a simple ANN.
The machine learning models were trained using the power of nine electrode-frequency band combinations identified by the repeated measures ANOVA. These features capture the changes in EEG signal power across different fear intensity levels, providing the necessary input for the classifiers.
Each model was evaluated using 5-Fold cross-validation, ensuring robust performance estimation. The average accuracy of the five folds was calculated and used as the primary metric for model evaluation.
SVM is a well-known method for EEG emotion classification. Two versions of SVM were trained for this task:
The KNN classifier, trained with K = 3, also achieved an accuracy of 72%, similar to the SVM with the RBF kernel. KNN is a simple yet effective classifier that assigns class labels based on the majority vote of its nearest neighbors.
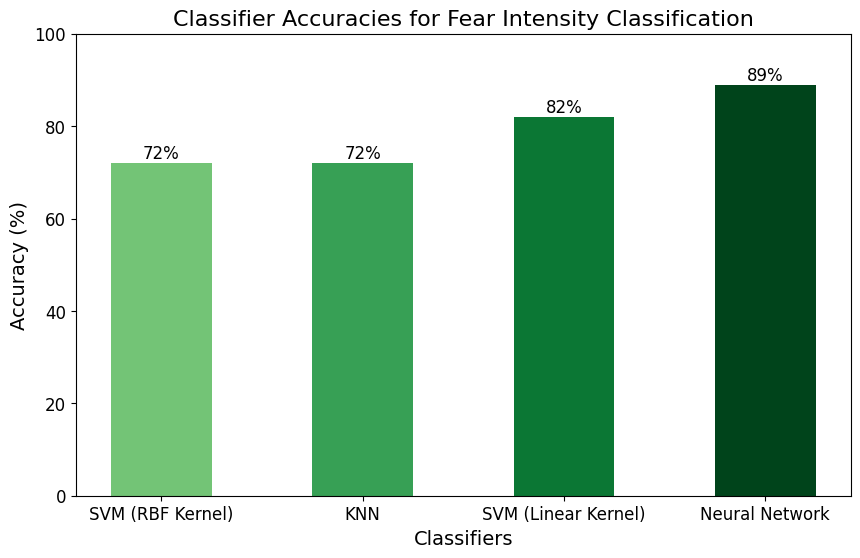
This research demonstrated significant changes in brainwave activity related to varying levels of fear intensity, particularly in the Alpha, Beta, Theta, and Delta bands across specific electrodes (Fp2, F7, and F4). Machine learning models were successfully trained to classify fear intensity, with the neural network achieving the highest accuracy at 89%. The findings suggest the potential of EEG signals in detecting emotional responses, particularly fear, and the effectiveness of classifiers like SVM, KNN, and neural networks for this task.
Several limitations were encountered during the experiment. First, the small sample size of participants may have impacted the generalizability of the results. Increasing the number of participants would likely improve the robustness and reliability of the findings. Second, the application of the EEG headset was challenging, particularly for female participants, which sometimes resulted in poor signal quality due to improper electrode contact. Additionally, technical issues with the headset’s wires restricted the use of only 8 electrodes, even though the headset supports up to 19 locations. This limitation may have reduced the resolution of the recorded EEG signals and potentially impacted the accuracy of the analysis.
Addressing these limitations in future studies could further enhance the accuracy and reliability of EEG-based fear detection.
This study explored the relationship between EEG signals and varying levels of fear intensity, focusing on identifying significant changes in brainwave activity. EEG data from eight electrodes were analyzed, with the Alpha, Beta, Theta, and Delta frequency bands showing significant correlations to fear levels. Machine learning models, including SVM, KNN, and a neural network, were trained to classify fear intensity between low and medium levels. The neural network achieved the highest accuracy at 89%. While the study demonstrated promising results in emotion classification, limitations such as a small sample size and equipment challenges suggest that future work could further refine the methodology and improve the reliability of findings.
J. A. Russell, “Affective space is bipolar.,” Journal of Personality and Social Psychology, vol. 37, pp. 345–356, 1979. Link
H. Dabas, C. Sethi, C. Dua, M. Dalawat, and D. Sethia, “Emotion classification using eeg signals,” in Proceedings of the 2018 2nd International Conference on Computer Science and Artificial Intelligence, CSAI ’18, (New York, NY, USA), p. 380–384, Association for Computing Machinery, 2018. Link
EEGLAB Matlab package https://sccn.ucsd.edu/eeglab/index.php
OpenBCI (Headset Manifacturer) https://openbci.com/