Executive Summary
This report analyzes the relationship between phenotypes and their causal genes using embedding vectors generated through GPT-3.5 and OpenAI's text-embedding-3-large model. The analysis explores whether these embeddings can indicate gene causality through various dimensionality reduction and clustering techniques.
Dataset Creation and Preprocessing
Data Sources
• Phenotypes and genes dataset (opentargets_step2.for_llm.tsv)
• Ground truth labels (gwas_catalog_step2.labels)
• Phenotype embeddings (phenotype_embeddings.csv)
• Gene embeddings (gene_embeddings.csv)
Sampling Methodology
• Used MD5 hash of "BHARAT" as seed for reproducibility (seed= 8859348)
• Randomly sampled 500 phenotypes from the dataset
• Created mappings between phenotypes and both causal and non-causal genes
Preprocessing Steps
- Filtered phenotype_and_gene data using ground_truth indices.
- Cleaned gene string data by removing ENS identifiers
- Removed unnecessary columns and handled null values
- Created non-causal gene selections (3 per phenotype)
- Merged datasets to create final mapped data containing both casual and non-casual embeddings.
Exploratory Data Analysis
Distribution Analysis
- Top 10 Casual Genes Distribution

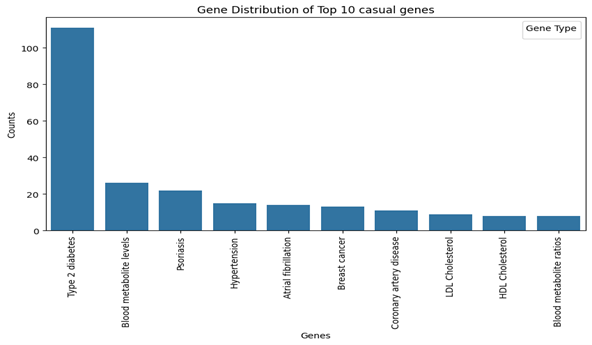
• Type 2 diabetes, blood metabolite level and psoriasis are most common.
Case Study: Type 2 Diabetes
• Analyzed unique casual genes associated with Type 2 diabetes

• Investigated common genes between casual and non-casual categories

Embedding Analysis
Casual Gene Embeddings Visualization (t-SNE)
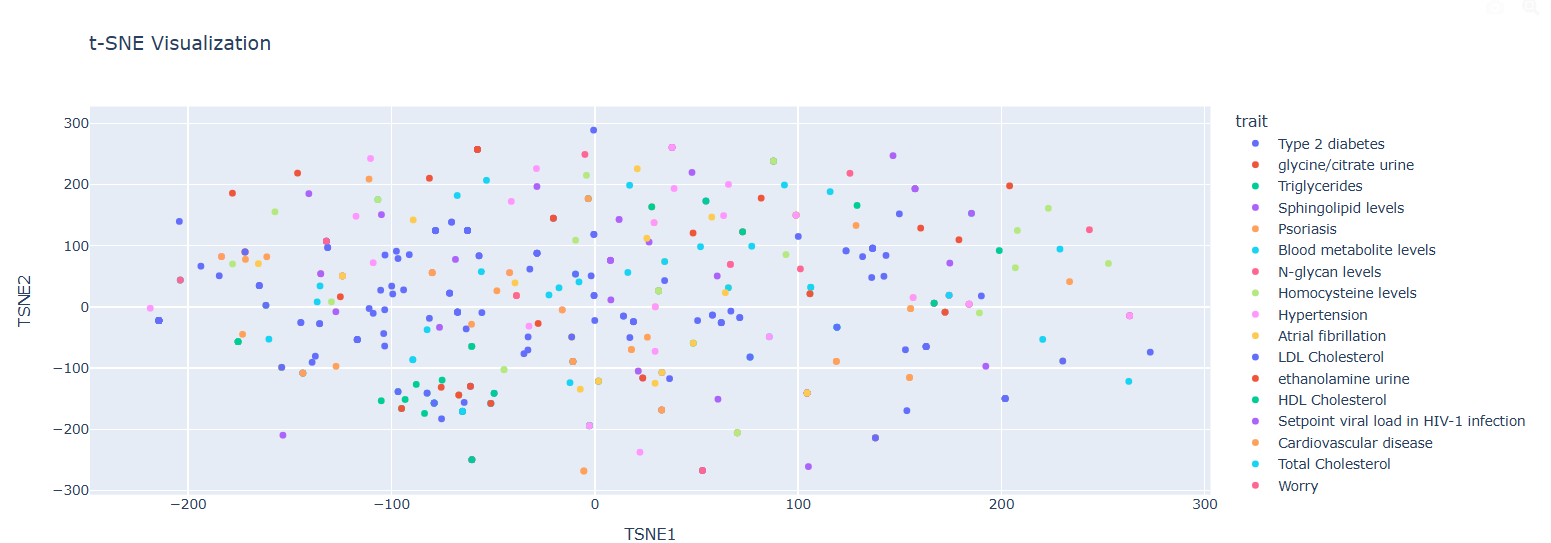
Observations:
• Distinct clustering of traits visible
• Embeddings show clear grouping based on traits
• Proximity indicates genetic similarity
Non-Casual Gene Embeddings Visualization (t-SNE)
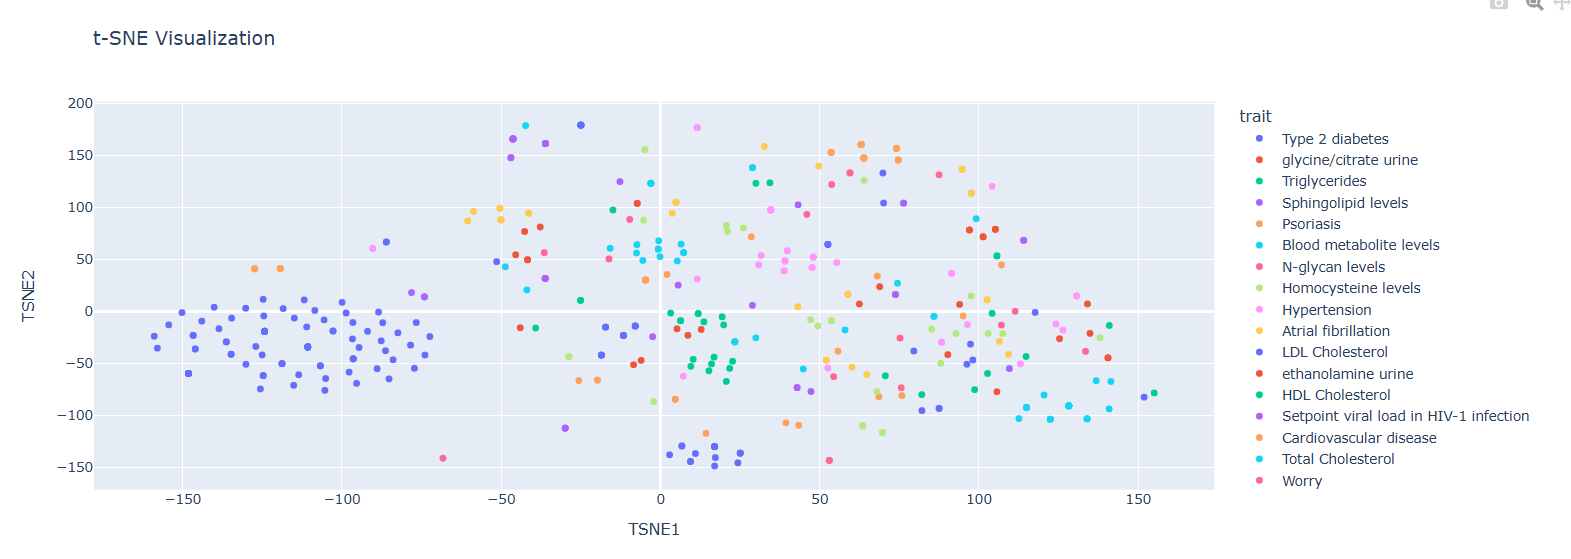
Observations:
• Tighter grouping compared to casual embeddings
• Type 2 diabetes shows high prevalence
• More shared information among phenotypes
Combined Embedding Analysis
PCA Visualization
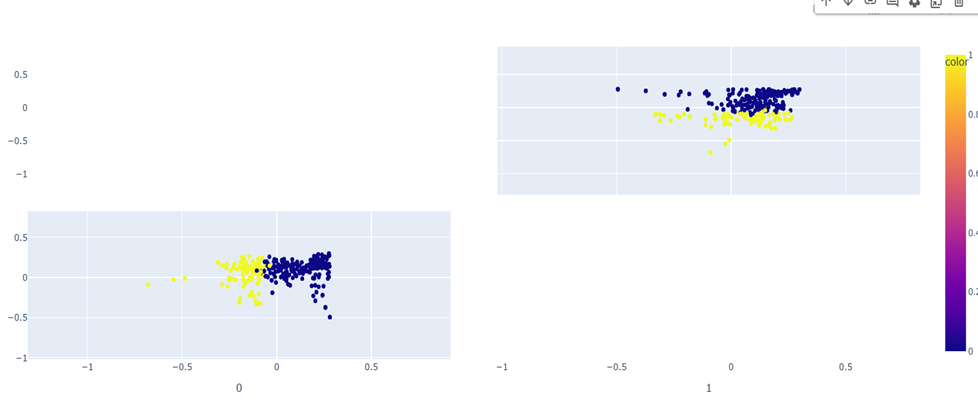
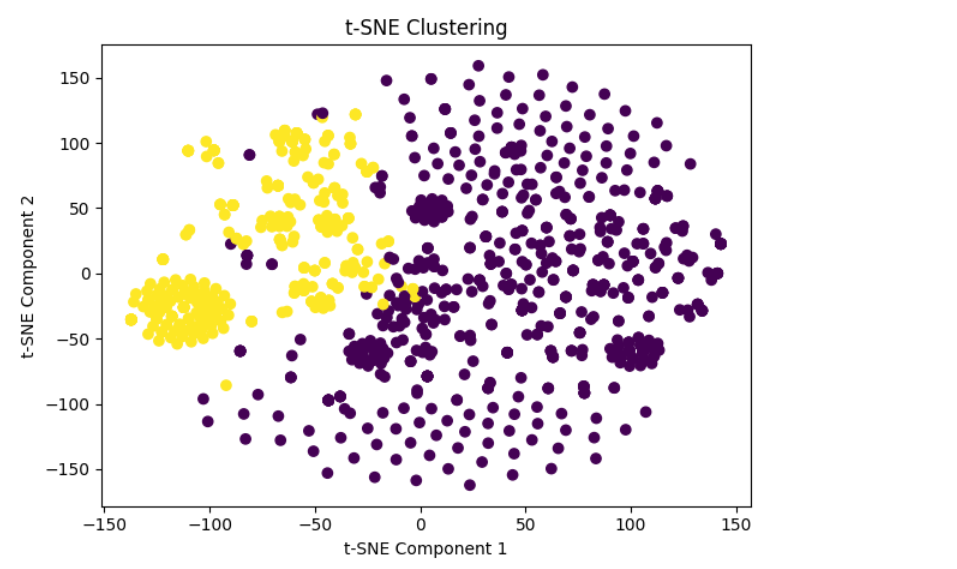
t-SNE Clustering

UMAP Visualization
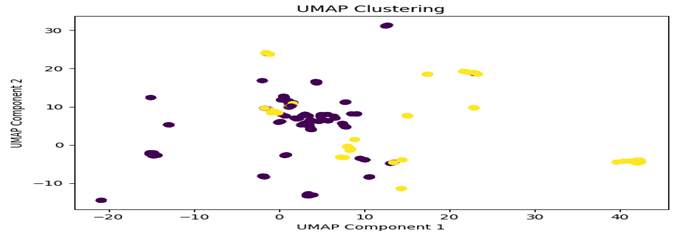
Observations:
The visualizations reveal distinct patterns between casual gene embeddings and phenotype embeddings, though the separation is not absolute. While the clusters demonstrate notable differences between the two types of embeddings, there exists some overlap between them, suggesting that certain genes may share characteristics across both casual and phenotypic expressions. This partial overlap indicates that while embedding patterns can help distinguish between casual and non-casual relationships, they alone may not be sufficient for definitive classification.
Detailed Clustering Analysis

Observations:
• Distinct Clusters: The clear separation between the purple and green clusters indicates that the embeddings can be grouped into two distinct categories. This suggests that there are significant differences between the gene and phenotype embeddings in each cluster.
• Tight Grouping: The purple cluster appears more tightly grouped, indicating that the genes and phenotypes in this cluster are more similar to each other. Dispersed Grouping: The green cluster is slightly more dispersed, suggesting more variability among the genes and phenotypes in this group. Centroids
Statistical Analysis
Similarity Metrics
- Cosine Similarity
o Score: 0.3 (indicating low similarity between casual and non-casual embeddings)
o Suggests distinct characteristics between phenotypes and their associated genes - Average Dot Product
o Shows low relationship between embedding types
o Supports the cosine similarity findings - Silhouette Score
o Score: 0.13
o Indicates weak clustering structure
Key Findings
- Embedding Relationships
o Low similarity (0.3 cosine similarity) between gene and phenotype embeddings
o Weak clustering structure (0.13 silhouette score)
o Clear separation between casual and non-casual embeddings - Clustering Patterns
o Two distinct clusters identified through various visualization methods
o Purple cluster shows tighter grouping
o Green cluster displays more dispersion - Phenotype-Gene Associations
o Type 2 diabetes shows significant presence in the dataset
o Phenotype embeddings show more commonality than gene embeddings
o Clear separation between casual and non-casual relationships - Technical Insights
o Dimensionality reduction techniques effectively visualize relationships
o Multiple visualization methods confirm clustering patterns
o Low silhouette score suggests complex relationship structure
Limitations and Future Work
- Potential overlap between clusters
- Complexity in determining clear causality signals
Conclusions
The analysis reveals that while there are distinguishable patterns between casual and non-casual gene-phenotype relationships, the signal is not strong enough to definitively indicate causality based solely on embeddings. The low similarity scores and weak clustering structure suggest that additional factors beyond embedding relationships may be necessary for determining gene causality.