AdaBoost, or Adaptive Boosting, is a seminal ensemble learning algorithm developed for classification and later extended to regression. It combines multiple weak learners to form a strong learner in a sequential manner, focusing increasingly on difficult-to-classify instances. This blog post explores AdaBoost in detail, explaining its algorithmic steps, mathematical underpinnings, and proofs for crucial components like weight calculations.
Part 1: AdaBoost for Classification
Overview
AdaBoost starts with weak classifiers and iteratively enhances them by focusing more on the examples that previous classifiers misclassified. The algorithm adjusts the weights of incorrectly classified instances so that subsequent classifiers focus more on difficult cases.
Algorithmic Steps
Let's dive deeper into the mathematics of AdaBoost for binary classification, where the output labels are
Initialization:
For each iteration
- Train a classifier
using weights . - Calculate the error:
- Compute the classifier's weight:
- Update weights:
whereis a normalization factor to ensure that is a probability distribution.
Final Model:
Mathematical Formulation and Proof
Exponential Loss Minimization
The exponential loss function, used by AdaBoost, is defined as:
Classifier Weight Calculation
The weight
Proof:
- The loss function at step
is:
- Setting the derivative of
with respect to to zero for minimization, we find:
This calculation shows that
Let's implement AdaBoost for classification using Python's scikit-learn library.
Importing Required Libraries and Generating Synthetic Data
from sklearn.ensemble import AdaBoostClassifier
from sklearn.tree import DecisionTreeClassifier
from sklearn.datasets import make_moons
import matplotlib.pyplot as plt

# Create synthetic data
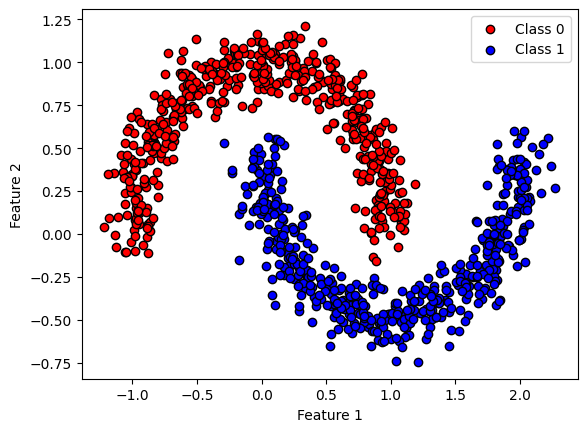
X, y = make_moons(n_samples=1000, noise=0.1, random_state=42)

# Lets plot the scatter plot of the data
plt.scatter(X[y == 0][:, 0], X[y == 0][:, 1], c='red', label="Class 0", edgecolor='k')
plt.scatter(X[y == 1][:, 0], X[y == 1][:, 1], c='blue', label="Class 1", edgecolor='k')
plt.xlabel('Feature 1')
plt.ylabel('Feature 2')
plt.legend()
plt.show()

Training an AdaBoost Classifier and Visualizing the Decision Boundary with each iteration at 1,2,4,8 and 16
def plot_decision_boundary(clf, X, y, axes):
    x1s = np.linspace(axes[0], axes[1], 100)
    x2s = np.linspace(axes[2], axes[3], 100)
    x1, x2 = np.meshgrid(x1s, x2s)
    X_new = np.c_[x1.ravel(), x2.ravel()]
    y_pred = clf.predict(X_new).reshape(x1.shape)
    plt.contourf(x1, x2, y_pred, alpha=0.3, cmap=plt.cm.brg)
    plt.scatter(X[y == 0][:, 0], X[y == 0][:, 1], c='red', label="Class 0", edgecolor='k')
    plt.scatter(X[y == 1][:, 0], X[y == 1][:, 1], c='blue', label="Class 1", edgecolor='k')
    plt.xlabel("Feature 1")
    plt.ylabel("Feature 2")
    plt.legend()

# Assuming X (features) and y (labels) are predefined
# You can define your own dataset or use a predefined dataset

# Initialize AdaBoost classifier with Decision Tree as base estimator
fig, axes = plt.subplots(2, 3, figsize=(15, 10))
for i, n_estimators in enumerate([1, 2, 4, 8, 16,64]):
    ada_clf = AdaBoostClassifier(
        DecisionTreeClassifier(max_depth=1), n_estimators=n_estimators,
        algorithm="SAMME.R", learning_rate=0.5, random_state=42)
    ada_clf.fit(X, y)

    plt.subplot(2, 3, i + 1)
    plot_decision_boundary(ada_clf, X, y, axes=[-1.5, 2.5, -1, 1.5])
    plt.title(f'n_estimators = {n_estimators}')
plt.tight_layout()
plt.show()

Let's check the performance of AdaBoost on a real-world dataset.
# Define the datasets
datasets = [
    load_breast_cancer(),
    load_digits(),
    load_wine(),
    load_iris(),
    make_moons(n_samples=500, noise=0.3, random_state=42)
]

dataset_names = [
    'Breast Cancer',
    'Digits',
    'Wine',
    'Iris',
    'Moons'
]

# Define the number of runs
num_runs = 5

# Initialize lists to store results
results = []

# Loop through datasets

for data_idx , dataset in enumerate(datasets):
    if data_idx != 4:
        X, y = dataset.data , dataset.target
    else:
        X, y = dataset[0] , dataset[1]
    # Loop through runs
    for run in range(num_runs):
        # Split the data into training and testing sets
        X_train, X_test, y_train, y_test = train_test_split(X, y, test_size=0.3, random_state=run)

        # Initialize AdaBoost classifier
        ada_clf = AdaBoostClassifier(
            DecisionTreeClassifier(max_depth=1),
            n_estimators=50,
            learning_rate=0.5,
            random_state=42
        )

        # Train the model
        ada_clf.fit(X_train, y_train)

        # Predict on the test set
        y_pred = ada_clf.predict(X_test)

        # Calculate metrics
        accuracy = accuracy_score(y_test, y_pred)
        precision = precision_score(y_test, y_pred, average='weighted')
        recall = recall_score(y_test, y_pred, average='weighted')
        f1 = f1_score(y_test, y_pred, average='weighted')

        # Store results
        results.append([dataset_names[data_idx], run, accuracy, precision, recall, f1])

# Create a DataFrame from the results
df = pd.DataFrame(results, columns=['Dataset', 'Run', 'Accuracy', 'Precision', 'Recall', 'F1'])

# Calculate mean and standard deviation for each dataset
mean_std = df.groupby('Dataset').agg(['mean', 'std'])

# remove Run
mean_std = mean_std.drop('Run', axis=1)

# Display the results in markdown
print(mean_std.to_markdown())
| Dataset | ('Accuracy', 'mean') | ('Accuracy', 'std') | ('Precision', 'mean') | ('Precision', 'std') | ('Recall', 'mean') | ('Recall', 'std') | ('F1', 'mean') | ('F1', 'std') |
|---|---|---|---|---|---|---|---|---|
| Breast Cancer | 0.960234 | 0.0145613 | 0.960508 | 0.0145336 | 0.960234 | 0.0145613 | 0.960256 | 0.0145395 |
| Digits | 0.675926 | 0.0589983 | 0.776139 | 0.0327064 | 0.675926 | 0.0589983 | 0.685911 | 0.0575857 |
| Iris | 0.928889 | 0.0243432 | 0.930921 | 0.022513 | 0.928889 | 0.0243432 | 0.928191 | 0.0249871 |
| Moons | 0.898667 | 0.0280476 | 0.901375 | 0.0288982 | 0.898667 | 0.0280476 | 0.898645 | 0.0279825 |
| Wine | 0.940741 | 0.020286 | 0.94529 | 0.0131307 | 0.940741 | 0.020286 | 0.940412 | 0.0207914 |
Conclusion
AdaBoost is a versatile algorithm that excels in both classification and regression tasks. Its ability to focus on harder cases through an adaptive weighting mechanism allows it to perform well even when individual classifiers are relatively weak. This guide provides a solid foundation for understanding and applying AdaBoost in various machine learning challenges.
References
- Freund, Y., & Schapire, R. E. (1997). A decision-theoretic generalization of on-line learning and an application to boosting. Journal of computer and system sciences, 55(1), 119-139.
- Hastie, T., Tibshirani, R., & Friedman, J. (2009). The elements of statistical learning: data mining, inference, and prediction. Springer Science & Business Media.