
Unveiling COBRA: A Novel Approach to Combined Regression
In the ever-evolving landscape of statistical analysis, the quest for accuracy in prediction models is relentless. Amidst a plethora of methods, a significant breakthrough is presented in the paper titled "COBRA: A Combined Regression Strategy" published in the Journal of Multivariate Analysis. This innovative method leverages multiple estimators to enhance predictive accuracy, especially in complex, high-dimensional data scenarios. Here's an in-depth look at COBRA, its methodology, theoretical implications, practical applications, and a reflection on its potential transformative impact on predictive analytics.
1. Introduction to Combined Regression Strategies
Recent advancements in statistical methods have seen a surge in combined procedures, driven by the diversity of estimation and prediction techniques available. Traditional methods often focus on linear aggregation of estimators; however, COBRA introduces a nonparametric and nonlinear approach that departs significantly from these traditional tactics. This method evaluates the proximity of training data to new observations using a collective of estimators, enhancing flexibility and adaptability in predictive modeling.
A Toy Example
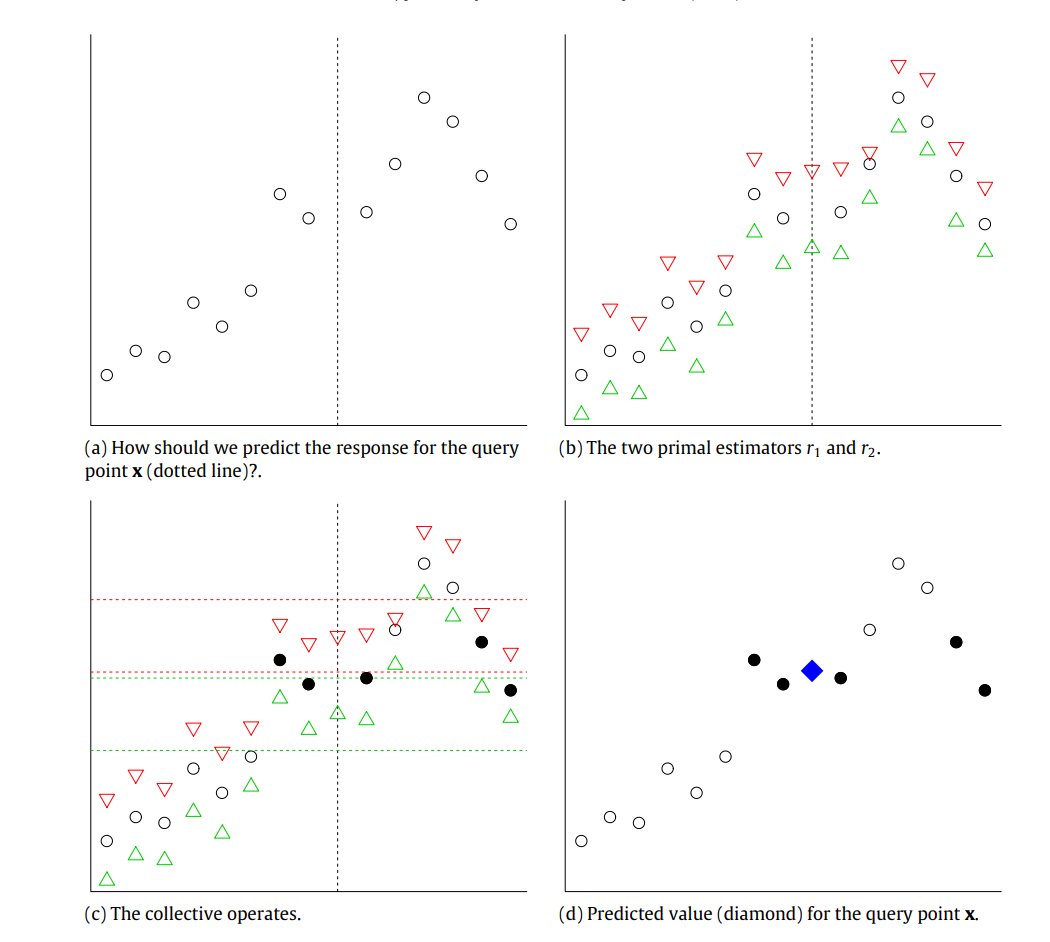
To elucidate the concept, consider a simplified example illustrated in Figure 1. We start with a set of observations depicted as circles on a plot. The predictions from two different models,
We define a proximity threshold,
By averaging the
2. The COBRA Methodology
COBRA stands for COmBined Regression Alternative and operates on a simple yet profound principle. Instead of seeking a linear or convex combination of basic estimators, it uses these estimators as a measure of "proximity" between existing data points and new observations. This approach is rooted in nonparametric statistics, relying on a "regression collective" where a set of preliminary estimators are used to inform the prediction of new data points.
The proposed methodology in the COBRA (COmBined Regression Alternative) paper introduces a novel approach to regression analysis that diverges from traditional linear or convex combinations of estimators. Instead, it employs a nonparametric and nonlinear strategy that utilizes multiple estimators to predict new observations based on their proximity to the training data. Here’s a detailed exploration of this methodology:
Throughout this article, we assume the availability of a training sample denoted by
For clarity, the dataset
The core methodology involves a collection
Given the basic machines
The weights
This methodology emphasizes a local averaging estimator, where predictions for
Optionally, the unanimity constraint within the weights can be relaxed to allow a certain proportion
This adaptive approach ensures that
Overview of COBRA Methodology
COBRA's methodology hinges on the concept of utilizing a collective of estimators to gauge the proximity between existing data points and a new observation, rather than averaging or optimizing across these estimators in the usual sense. This method is inherently nonlinear and nonparametric, offering a flexible and data-dependent way to combine predictions.
Detailed Steps in COBRA Approach
-
Selection of Basic Estimators:
The process begins by selecting a set of basic estimators, which can include a variety of regression models such as linear models, kernel smoothers, and more sophisticated machine learning algorithms like support vector machines or random forests. -
Forming the Regression Collective:
COBRA constructs what is referred to as a "regression collective" over these estimators. The core idea is to use these estimators not to form a single predictive model but to assess the similarity in their predictions for the training data and a new test observation. -
Defining Proximity through Unanimity:
For a new observation, the method considers another data point from the training set to be "close" if all estimators provide predictions for and that are within a pre-defined threshold . This threshold helps in determining which data points in the training set are relevant for predicting . -
Weighted Average Prediction:
Once the relevant data points are identified, COBRA calculates the prediction foras a weighted average of the target values associated with these points. The weights are defined based on the unanimity of estimator predictions falling within the proximity threshold.
Experimentation and Results
The COBRA methodology has been extensively tested through simulations and real-world applications, showcasing its superior performance in various scenarios. The method has been compared against other popular strategies like Super Learner and exponentially weighted aggregate, consistently demonstrating its competitive edge in terms of predictive accuracy and computational efficiency.
There are 12 Dataset generated for performance evaluation
-
Model 1:
- Setting:
- Formula:
- Setting:
-
Model 2:
- Setting:
- Formula:
- Setting:
-
Model 3:
- Setting:
- Formula:
- Setting:
-
Model 4:
- Setting:
- Formula:
- Setting:
-
Model 5:
- Setting:
- Formula:
- Setting:
-
Model 6:
- Setting:
- Formula:
- Setting:
-
Model 7:
- Setting:
- Formula:
- Setting:
-
Model 8:
- Setting:
- Formula:
- Setting:
Table: Model Performance Metrics
This table presents the mean (m.) and standard deviation (sd.) of quadratic error for various dataset (Model 1 to Model 8) across different algorithms, categorized into uncorrected and corrected results. The metrics are calculated for several algorithms.
| lars | ridge | fnn | tree | rf | COBRA | ||
|---|---|---|---|---|---|---|---|
| Uncorr. | |||||||
| Model 1 | m. | 0.1561 | 0.1324 | 0.1585 | 0.0281 | 0.0330 | 0.0259 |
| sd. | 0.0123 | 0.0094 | 0.0123 | 0.0043 | 0.0033 | 0.0036 | |
| Model 2 | m. | 0.4880 | 0.2462 | 0.3070 | 0.1746 | 0.1366 | 0.1645 |
| sd. | 0.0676 | 0.0233 | 0.0303 | 0.0270 | 0.0161 | 0.0207 | |
| Model 3 | m. | 0.2536 | 0.5347 | 1.1603 | 0.4954 | 0.4027 | 0.2332 |
| sd. | 0.0271 | 0.4469 | 0.1227 | 0.0772 | 0.0558 | 0.0272 | |
| Model 4 | m. | 7.6056 | 6.3271 | 10.5890 | 3.7358 | 3.5262 | 3.3640 |
| sd. | 0.9419 | 1.0800 | 0.9404 | 0.8067 | 0.3223 | 0.5178 | |
| Model 5 | m. | 0.2943 | 0.3311 | 0.5169 | 0.2918 | 0.2234 | 0.2060 |
| sd. | 0.0214 | 0.1012 | 0.0439 | 0.0279 | 0.0216 | 0.0210 | |
| Model 6 | m. | 0.8438 | 1.0303 | 2.0702 | 2.3476 | 1.3354 | 0.8345 |
| sd. | 0.0916 | 0.4840 | 0.2240 | 0.2814 | 0.1590 | 0.1004 | |
| Model 7 | m. | 1.0920 | 0.5452 | 0.9459 | 0.3638 | 0.3110 | 0.3052 |
| sd. | 0.2265 | 0.0920 | 0.0833 | 0.0456 | 0.0325 | 0.0298 | |
| Model 8 | m. | 0.1308 | 0.1279 | 0.2243 | 0.1715 | 0.1236 | 0.1021 |
| sd. | 0.0120 | 0.0161 | 0.0189 | 0.0270 | 0.0100 | 0.0155 | |
| Corr. | m. | ||||||
| Model 1 | m. | 2.3736 | 1.9785 | 2.0958 | 0.3312 | 0.5766 | 0.3301 |
| sd. | 0.4108 | 0.3538 | 0.3414 | 0.1285 | 0.1914 | 0.1239 | |
| Model 2 | m. | 8.1710 | 4.0071 | 4.3892 | 1.3609 | 1.4768 | 1.3612 |
| sd. | 1.5532 | 0.6840 | 0.7190 | 0.4647 | 0.4415 | 0.4654 | |
| Model 3 | m. | 6.1448 | 6.0185 | 8.2154 | 4.3175 | 4.0177 | 3.7917 |
| sd. | 11.9450 | 12.0861 | 13.3121 | 11.7386 | 12.4160 | 11.1806 | |
| Model 4 | m. | 60.5795 | 42.2117 | 51.7293 | 9.6810 | 14.7731 | 9.6906 |
| sd. | 11.1303 | 9.8207 | 10.9351 | 3.9807 | 5.9508 | 3.9872 | |
| Model 5 | m. | 6.2325 | 7.1762 | 10.1254 | 3.1525 | 4.2289 | 2.1743 |
| sd. | 2.4320 | 3.5448 | 3.1190 | 2.1468 | 2.4826 | 1.6640 | |
| Model 6 | m. | 1.2765 | 1.5307 | 2.5230 | 2.6185 | 1.2027 | 0.9925 |
| sd. | 0.1381 | 0.9593 | 0.2762 | 0.3445 | 0.1600 | 0.1210 | |
| Model 7 | m. | 20.8575 | 4.4367 | 5.8893 | 3.6865 | 2.7318 | 2.9127 |
| sd. | 7.1821 | 1.0770 | 1.2226 | 1.0139 | 0.8945 | 0.9072 | |
| Model 8 | m. | 0.1366 | 0.1308 | 0.2267 | 0.1701 | 0.1226 | 0.0984 |
| sd. | 0.0127 | 0.0143 | 0.0179 | 0.0302 | 0.0102 | 0.0144 |
These models were used to test the COBRA methodology under various conditions and complexities to evaluate its predictive performance against other methods. The diverse settings and formulations help highlight COBRA's adaptability and effectiveness across different types of regression problems.
Key Features of the COBRA Approach:
-
Nonlinearity and Nonparametric Nature: Unlike many existing methods, COBRA employs a nonlinear combination of estimators that is entirely data-dependent, adapting to the specific characteristics of the dataset.
-
Unanimity in Proximity: A data point is considered close to a new observation if all estimators predict similar values for both, within a predefined threshold. This collective agreement forms the basis for predicting new data points.
-
Model-Free Approach: Unlike many traditional regression methods that require specific model assumptions (linear, logistic, etc.), COBRA's strategy works independently of such constraints, making it versatile for a wide array of data types and structures.
-
Handling High-Dimensional Data: The methodology is particularly effective in high-dimensional settings where traditional methods may struggle. This is crucial in modern statistical applications where high-dimensional data are commonplace.
-
Asymptotic Performance Guarantees: Theoretical analysis in the paper shows that COBRA's performance is asymptotically at least as good as the best individual estimator in the collective, under general conditions.
3. Theoretical Underpinnings and Performance
The paper rigorously proves that COBRA's performance is asymptotically at least as good as the best individual estimator used within the collective. This result is significant as it holds universally across different distributions of data, provided basic assumptions on estimator bounds are met.
- Asymptotic Efficiency: The method achieves asymptotic efficiency by aligning closely with the best performing estimator in the collective.
- Nonasymptotic Risk Bound: Early in the sample size, COBRA provides strong performance guarantees relative to the best single estimator in the collective.
4. Practical Implementation and Software
COBRA is implemented in an R package, making it accessible for widespread use among statisticians and data scientists. The package allows for extensive customization and has been optimized for speed, particularly beneficial when dealing with large datasets.
- Empirical Validation: Numerous simulations and real-data applications demonstrate COBRA's superior performance, particularly in terms of speed and predictive accuracy.
- Comparison with Other Methods: Benchmarks against methods like Super Learner and the exponentially weighted aggregate show that COBRA often outperforms these well-established competitors.
5. Concluding Remarks
The COBRA method marks a significant step forward in regression analysis. By combining estimators in a novel, nonlinear fashion, it offers a robust alternative to both traditional and contemporary methods. Its ability to handle high-dimensional data with ease and its proven theoretical guarantees make it a valuable tool for any statistician's arsenal.
As predictive modeling continues to evolve, COBRA's flexible, efficient, and theoretically sound approach positions it as a go-to method for complex statistical challenges, paving the way for further innovations in the field of multivariate analysis.