Abstract
This project focuses on generating Month-end and Year-end reports related to Policy, Claims, and Sales for the Western European Market (WEM). The objectives are to reduce operating costs and gain efficiencies through vendor consolidation, enhance productivity and service quality annually, and accelerate the process of scaling up resources to meet business demands. WEM operations span four countries: Spain (including the "Genesis" brand), Ireland, Northern Ireland (Hughes Insurance), and Portugal. Initially, the project targets private motor insurance with Liberty Insurance (Ireland), Genesis (Spain), Liberty Seguros (Portugal), and Regal (Catalonia, Spain).
The Technical Data Architecture for WEM includes multiple source systems such as EIS (PostgreSQL RDS), Outsystems (Microsoft SQL RDS), Rating (Amazon DynamoDB), Legacy systems (AS/400/DB2), Bank sources/Hydra (Adyen, JPMC), and RDM (Source files CSV Files). AWS Pipeline (DMS task, LAMBDA function, ABC function, STEP function) will be used for PostgreSQL, Microsoft SQL, DynamoDB, and JPMC sources, while IICS mappings will extract data from DB2 and RDM files to Redshift Db. Data will flow from sources to Redshift DB (Stage & ODS tables) for transformation and loading into Dim/Fact tables. Final reports will be generated from views built on these tables.
Introduction
The main purpose of the project is to generate different Month-end and Year-end reports (related to Policy, Claims, Sales etc.). The key objectives of the project are to:
- Reduce operating cost & gain efficiencies of scale through vendor consolidation.
- Enhance productivity & quality of service year on year.
- Fasten the process of scaling up the resources to support business demands.
This project is intended to only Western European Market (WEM). WEM comprises of operations in 4 countries:
- Spain (Liberty Seguros Spain - including the "Genesis" brand),
- Ireland (Liberty Ireland),
- Northern Ireland (Hughes Insurance) and
- Portugal (Liberty Seguros Portugal).
For the purposes of the GDE (The Global Digital Ecosystem) engagement with WEM, the focus at first is on efforts relating to private motor insurance with Liberty Insurance (Ireland) & the Genesis "brand" (Spain), with Liberty Seguros (Portugal) and Regal "brand" (Catalonia, Spain)
also being in scope.
The Data platform architecture consists of multiple sources systems which are listed below.
EIS – PostgreSQL RDS
Outsystems – Microsoft SQL RDS
Rating – Amazon DynamoDB
Legacy systems – AS/400/ DB2
Bank sources/Hydra – Adyen, JPMC
RDM – Source files CSV Files
Note: for sources (PostgreSQL, Microsoft SQL, DynamoDB & JPMC) we will be using AWS Pipeline (DMS task, LAMBDA function, ABC function, STEP function etc.) and for sources DB2 & RDM files, we will be using IICS mappings to extract the data from source to Redshift Db and then we will be applying different transformation to prepare and load the data in proper
locations.
Once the data from different sources are loaded in the Redshift DB (Stage & ODS tables), then they will be loaded in the Dims/Fact tables and on top of facts and dimensions several views will be created which will be used to generate the Month-end & Year-end reports.
Limitations in the Existing Systems
- Cloud Implementation - Most of the methods in the existing journals are not based on cloud architecture.
- Multiple Sources - The design of the existing method is not compatible with multiple sources like Microsoft SQL, CSV files etc.
- Scalability - The existing architectures are not scalable enough which causes issue while handling a large amount of data
- Real-time Integration - IICS supports real-time, enabling us to access and analyse data as it becomes available.
Proposed Enhancements
In our ETL process we have used Informatica Intelligent Cloud Services (IICS) as the ETL tool, as IICS has several features which help us to resolve the limitations in other processes. Some of the advantages that our ETL process has over the previously mentioned processes are as follows –
-
Implemented on Cloud containers: As mentioned earlier we have used IICS as the ETL tool, which is one of the best Cloud ETL tool available in market. As a cloud-native platform, IICS leverages the scalability, flexibility, and cost-effectiveness of cloud infrastructure. This architecture eliminates the needs of on-premises hardware and maintenance, reducing IT overhead and enabling faster time-to-value.
-
Various data sources: IICS offers seamless connectivity to a wide range of data sources and applications. In our end-to-end process we are able to use different sources as PostgreSQL, Microsoft SQL, Amazon DynamoDB, CSV Files etc.
-
Scalable: IICS is designed to scale effortlessly, allowing organizations to handle large volumes of data without compromising performance. It can easily adapt to growing data needs, making it suitable for business of all sizes.
-
Real-time Integration: IICS supports real-time, enabling us to access and analyze data as it becomes available. This real-time visibility into business processes allows for faster decision-making and greater agility in responding to changing market conditions.
-
User-friendly interface: IICS provides a user-friendly interface that allows developers to quickly design, deploy and manage data integration processes without extensive coding language. Its drag-and-drop interface simplifies the development process, making it accessible to a wider range of users.
Objective of the study
The primary objective of this study is to develop an automated ETL (Extract, Transform, Load) pipeline to generate financial reports at both month-end and year-end for the Western European Market (WEM). This project aims to improve operational efficiency, reduce costs, and enhance service quality through vendor consolidation and automation.
The specific goals include:
- Automating Report Generation: To create a system that automatically generates financial reports related to policies, claims, and sales, eliminating manual effort and reducing errors.
- Operational Efficiency: To streamline the report generation process, reducing the time and resources required to produce accurate and comprehensive financial reports.
- Scalability: To design a solution that can scale with increasing data volumes and business growth, ensuring that the reporting system remains efficient and effective.
- Data Integration: To integrate multiple data sources, including PostgreSQL, Microsoft SQL, DynamoDB, DB2, and CSV files, into a unified reporting system using AWS services and Informatica Intelligent Cloud Services (IICS).
- Business Insights: To provide valuable insights into the business operations of WEM across four countries (Spain, Ireland, Northern Ireland, and Portugal), aiding in better decision-making and strategic planning.
Dataset details
The dataset used in this study primarily consists of data related to policies, claims, and sales for the Western European Market. The data is sourced from multiple systems, including:
- EIS (PostgreSQL RDS): Contains policy and claims data stored in a relational database.
- Outsystems (Microsoft SQL RDS): Another relational database system storing policy-related data.
- Rating (Amazon DynamoDB): A NoSQL database storing rating and pricing information.
- Legacy Systems (AS/400/DB2): Older systems storing historical data related to policies and claims.
- Bank Sources/Hydra (Adyen, JPMC): Financial transaction data from payment processors.
- RDM (CSV Files): Various data files in CSV format providing additional information required for report generation.
The ETL pipeline uses AWS services such as DMS tasks, Lambda functions, and Step Functions to extract data from these sources. Data is then transformed and loaded into a centralized Redshift database, where it is processed and used to generate the final financial reports.
Requirement & Architecture analysis
The Data platform architecture consists of multiple sources systems which are listed below.
- EIS – PostgreSQL RDS
- Outsystems – Microsoft SQL RDS
- Rating – Amazon DynamoDB
- Legacy systems – AS/400/ DB2
- Bank sources/Hydra – Adyen, JPMC
- RDM – Source files CSV Files
From the above-mentioned diverse sources, the data is getting loaded in the landing layer i.e., S3 Bucket Tier 1. After that, the ETL Framework consists of 2 components: Actual data pipeline and Reference data pipeline.
Component 1: Actual data pipeline
Data loaded in S3 Bucket Tier 1 Landing Layer will contain raw data. Data from S3 Bucket Tier 1 Layer will take 2 different ETL paths to process through different layers before loading to Facts and dimensions.
Path 1: (IICS Pipeline)
a. S3 Bucket Tier 1 (Landing Layer) to S3 Bucket Tier 2 (Cleansed Layer): Data from S3 Bucket Tier 1 will be loaded to S3 Bucket Tier 2 using IICS which involves different Data format conversion Transformations.
b. S3 Bucket Tier 2 (Cleansed Layer) to Facts and Dimension: External Table will be configured on top of S3 Bucket Tier 2-layer files. Data from external tables be loaded to Facts and Dimensions with SCD2 Type configuration using IICS.
Path 2: (New ETL Framework Pipeline)
The new ETL Framework is configured to load the data from S3 Bucket Tier 1 to Facts and dimensions. This involves below flow which will process data using python and SQL scripts-
S3 Tier 1 -> Staging -> ODS -> Batch Master -> Dim/Fact
➢ S3 Tier 1 (Maintains History),
➢ Staging (Truncate and Load) [DB: Redshift],
➢ ODS (Maintain SCD1 Type) [DB: Redshift],
➢ Batch Master (Truncate and Load) [DB: Redshift],
➢ Dim/Fact (Maintain SCD2 Type) [DB: Redshift]
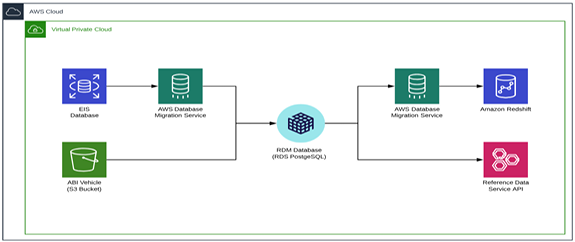
Component 2: Reference data pipeline
Reference Data Management: Reference data is data used to classify or categorize other data. Typically, they are static or slowly changing over time.
a. The actual RDM model is held on an RDS PostgreSQL database and is based on a Data Vault modeling method.
b. Multiple data sources of reference data can load into RDM, and different delivery/retrieval methods of this data are used, for example DMS replication task and IICS mappings.
Architecture Diagram
Fig below: WEM Technical Data Architecture
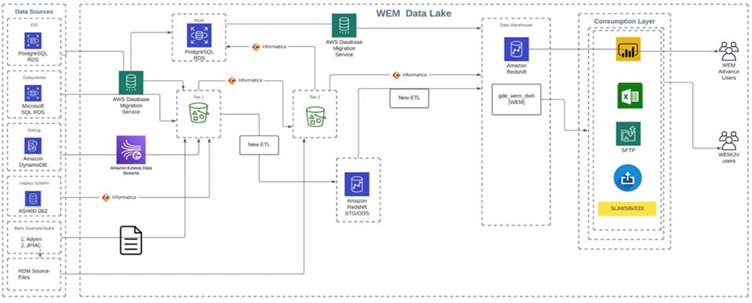
Fig below: Reference Data Management architecture diagram
Development Work
AWS Pipeline
AWS S3:
The data coming from various source systems is ingested into the AWS S3 Tier 1 bucket through AWS DMS and AWS Kinesis on real time basis as csv format. This becomes the source folder for data to be merged on scheduled times either hourly or daily (depending upon the source).
Merger Operation:
A lambda function/ECS server (depending upon the volume of data) is scheduled via CloudWatch cron to run on hourly basis. This function will merge files from folder where data is ingested on S3. File names in above folder contains timestamp, hence merging is done according to name of files. The merged files are then
stored in the same S3 bucket in a different folder. The files are stored in two different formats – csv and parquet. External tables are created on top of parquet files, partitioned on daily basis. This will help us to query raw data.
Step Function:
The csv files are used to load the data into stage through step functions. Once merging is done, a new lambda is invoked. A pointer file is read by this function which contains the parameters like start_time and end_time. This pointer file resides on the same S3 bucket. The lambda function checks if the last triggered step function is still in running state or not, if yes then step function will not trigger else step function will start executing. The step function has multiple steps to load the data in different layers. The layers are listed and described below:
- Stage layer
- ODS layer
- Batch master layer
- Dim and fact layer
- Final stage
Python Scripts
The below Python scripts are created for the data load process –
Create_stg_ods_table.py –
This python script is for reading the excel and creating table in redshift STG & ODS. This script will do the following job:
- Connect to redshift using redshift_connector.
- Read excel data using pandas (The excel should have the table metadata from source database)
- Generate DDL query for list of tables mentioned.
- Execute that query and tables will be created on STG and ODS schemas.
auto_config_generator.py –
This python script is used to create a template config file, which can be modified as per our need. It will contain the following details:
- table_name : Name of folder on S3 source location
- redshift_table_name : Name of table on redshift STG schema
- column_rename : List of columns that needs to be renamed.
- sort_by_columns, group_by_columns, timestamp_columns: These values are needed to find the latest record for each PK in table.
- primary_key: List of columns acting as PK
- destination_folder : source_system_Temp/Data/CSV/"
- file_location : AGGREGATE/source_system/CSV/public/"
Sample config.json file -
{
 "table_details": {
   "table-name": "billablepolicytern",
   "redshift_table_name": "stg_billablepolicyterm"
},
"column_rename": {
},
"sort_by_columns": [
   "ID",
   "TS MS"
],
"group_by_columns": [
   "ID"
],
"timestamp_columns": [
   "TS MS"
],
"Primary_key": [
   "ID"
],
"other_details": {
   "destination_folder": "EIS_Temp/Data/CSV/",
   "file_location": "AGGREGATE/EIS/CSV/public/"
}
}
s3_to_ods_full_load.py –
This python script will load data from s3 to ODS layer using copy command. Table list inside the script must be edited according to need.
tables_config.json:
{
  Tablename": {
     "stage_table": "stg_tablename",
     "ods_table": "ods_tablename",
     "primary_key": [ List of columns acting as PK],
     "stage_schema_name": "stg_schemaname",
     "ods_schema_name": "ods_schemaname"
}
global_config.json
{
  "redshift_Creds": {
      "stage_schema_name": "gde_wem_stg"
   },
   "table_name": {
      "qualification",
      "posadjustments",
      "paymentoption",
      "policysummary",
      "customer",
      "contactinfo",
      "addressline"
   }
}
The above two config files (.json script) stores all the table details that needs to be created. In case any new tables need to be created in later stages, then that table details need to be added in theses config files and when the python script will run it’ll create that new table in redshift.
Movefile.py
This python script is used to move the report once generated through the IICS mapping execution to the proper predefined location so that the customer can access the report with ease. We have used the AWS S3 CP command to move the file.
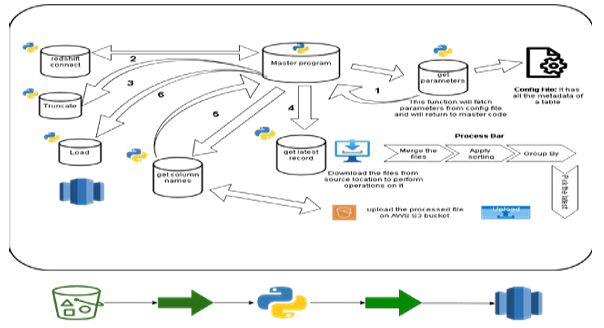
Fig above: AWS S3 > Redshift using python script
Stage, ODS & Batch Master Table
Stage layer:
This Layer contains incremental data load. A function will read a file from AWS S3 and perform partitioning and sorting to pick the latest record from the file and then dump that file in stage folder in S3. The data is then copied to the redshift stage internal tables.
ODS Layer:
This layer does not preserve the history of the data. Load happens based on parameter ‘is_update’. If this parameter is set to ‘True’, it indicates we are dealing with data that has updates on the same id or have an operation type.
- If any record with operation type 'D' is coming in stage, then ODS will update the records for that ID in ODS table. for e.g. It will update the op and ts_ms column in ODS.
- In the second step, this job will check if any id is in stage and ODS, meaning there is some update on that id. So, it will delete that id from ODS, and that updated record will be inserted in ODS in next step.
- In the third step, the job will insert all the records (id`s that are not present) into ODS. If ‘is_update’ is false, then it implies that all the incremental load from the stage layer must load into the ODS since there is never an update on the same id.
Batch Master Layer:
Batch Master Layer table stores id of master table for every batch load for each entity. Batch master tables act as master table (driving entity) for dimension or fact query. Useful for updating data in dimension tables and updating the current record flag for scd type 2 dimensions.
Dims/Facts Table
In this Layer Data loads into the dimension or fact tables based on their SCD types. - A source SQL query for dimension table is present which creates a temp table with joins using batch master table and the ODS tables to fetch latest records.
- Insertion or updation happens based on the parameter ‘is_update,’ which when set to ‘Y,’ data comparison happens based on record_checksum.
- If a table is SCD type 1 then data is upserted and if it’s SCD type 2 then data is inserted with its history preserved consisting of an active record flag (current record flag).
- The current record flag is updated using a post SQL logic which runs after the data load. The dimension tables provide a denormalized view of the data, containing summarized and aggregated information for easier analysis and reporting purposes.
Materialized Views
Several materialized views are created on top of the Dims/fact tables in Redshift database. The main purpose of these materialized views is to be used as the primary sources for the final report that will be generated through the IICS mappings.
For different reports there are different materialized views with different logic. For example –
- There are two type of financial reports that need to be generated monthly, one should contain the historical data and the other should contain only the current month data. For this reason, there are two views based on the current_record_flag. The one that should have the historical data have the condition (where current_record_flag=0) and the other view has the condition (where current_record_flag=1)
- To generate the invoice report at the month-end, one materialized view has been created on dim_invoice table after joining with other required tables like dim_policy, dim_customer, dim_location etc.
IICS Mapping / Mapping tasks / Taskflow
We have created the IICS mappings for mainly two purposes –
a) Load the data from S3 to Redshift
b) Generate the different reports by ingesting data from different redshift tables
and materialized views
(A) Loading data from S3 to Redshift tables:

For loading data from S3 to Redshift tables, we have created a simple mapping which has one Source transformation, one Expression Transformation and one Target.
- Source transformation – Source transformation has the connection to the AWS S3 bucket and through this we can access and get the data available in S3 bucket.
- Expression transformation – The expression transformation is used for cleansing job (Extra space removal, unwanted non-numeric character removal etc.) and data type conversion (as the source in S3 bucket is mostly flatfile, so all the columns have character datatype as default, that’s why before loading to Redshift tables, it’s better to convert the datatype for the ease of future calculations).
- Target – Target has the connection to the proper Redshift Tables and with this we can load the data into the Redshift tables.
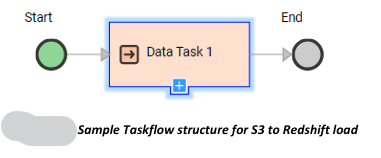
After the mappings are created the corresponding mapping tasks and Taskflows are created. The Taskflow has one datatask which triggers the mapping task and when the Taskflow is run it triggers the mapping and load the data.
(B) Generating different financial reports:
For generating the different financial reports, different complex IICS mapping along with the Mapping task and Taskflows are created. There are different transformations used in the IICS mappings to implement the different business logic as per the customer needs. The below figure shows a sample IICS mapping for generating financial reports.
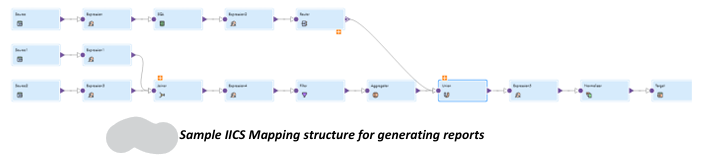
- Source – There are 3 sources in the mapping and all of them has the connection to Redshift DB. The 3 sources connect to different Materialized view or Dims/Fact tables in Redshift.
- Expression transformation - Expression transformation is used for different purposes such as concatenation of any particular fields, conditional formatting (if….else, decode etc), Date/time format change etc.
- SQL transformation – This is used to run any SQL query inside the IICS mapping and get the output of that query. We can run a simple SELECT COUNT(*) or we can select any particular field(s) from any table and store that value *in the output field and can use that further in the mapping.
- Filter transformation – This transformation filters the data based on the given condition.
- Router transformation – This transformation routes the data based on the groups created. For example, if for a particular dataset id has a range of 1 to 10 then we can divide that in two parts (Group1 – id<=5, Group2 – id>5) using the router transformation and use the two different group in two different ways.
- Joiner transformation – This one is used as the join in SQL, we can use both INNER JOIN or LEFT/RIGHT JOIN or FULL OUTER JOIN within this transformation.
- Aggregator transformation – We can do the mathematical calculations such as summation count etc. in this transformation.
- Normalizer transformation – This is used to normalize the data.
- Union – This is used to merge the two or more flows of data into a single flow.
- Target – The target has the structure of the reports in the required format and after all the calculations and implementation throughout the mapping process, the value for the report fields is generated and mapped to the proper field in the target.
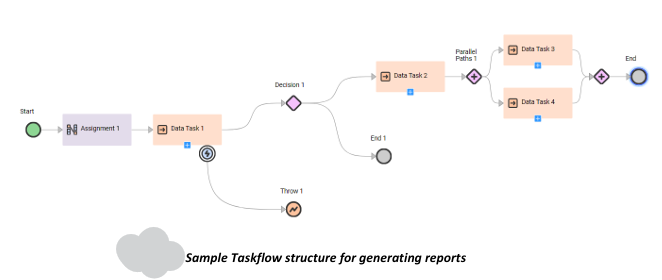
The Taskflow structure has multiple datatask and other different tasks. - Datatask – Multiple datatask correspond to different Mappings / Mapping tasks. After one task completes then only the other task will start as per the configuration.
- Assignment task – This is used to assign any values to the parameters prior to start the mapping execution.
- Decision task – Based on the decision task configuration (whether a certain field is True/False or have any particular value), the next mapping task execution will start or the overall Taskflow execution will end.
- Parallel Path task – Using this task we can execute multiple datatask parallelly without affecting each other.
- Throw task – When a datatask fails we configure it to throw a certain error message to better understand the issue and debug.
- End – This task ends the complete Taskflow execution.
Future Scope of Works
While the current ETL pipeline implementation has achieved significant milestones, several areas offer potential for further enhancement and expansion.
Advanced Analytics and Machine Learning:
Incorporating advanced analytics and machine learning algorithms can enhance the predictive capabilities of the financial reports. For instance, machine learning models could be used to forecast financial trends, detect anomalies, and provide deeper insights into data patterns.
Enhanced Data Governance and Security:
Future developments should focus on strengthening data governance frameworks and security measures. Implementing role
based access controls, data encryption, and compliance with data protection regulations such as GDPR will be essential as the system scales.
User Interface and Reporting Tools:
Developing a more user-friendly interface and integrating advanced reporting tools can enhance the accessibility and usability of the financial reports. Tools like Tableau or Power BI could be integrated to allow for dynamic and interactive reporting capabilities.
Automated Documentation and Monitoring:
Implementing automated documentation tools can ensure that the ETL processes are well-documented and easily maintainable. Additionally, enhancing monitoring and alerting systems will help in proactive issue detection and resolution.
Expansion to Other Markets:
While the current project is tailored for the Western European Market, similar ETL pipelines can be developed for other geographical regions or business domains. This would involve customizing the pipeline to handle different data sources, regulations, and reporting requirements.
By addressing these areas, the ETL pipeline can evolve into a more sophisticated, efficient, and versatile solution, providing even greater value to the organization and its stakeholders.
Acknowledgements
I would like to express my gratitude for the opportunities and support that have enabled me to explore various aspects of Data Science and Artificial Intelligence, applying them to an industry-specific use case. My sincere thanks to my co-worker, Mr. Amartya Roy, whose domain-specific insights and technology-related
recommendations greatly contributed to shaping this work. I also extend my appreciation to all professional and personal acquaintances who have supported me throughout this journey. Lastly, I am deeply grateful to my parents and family members for their unwavering support and encouragement.
Conclusions
The dissertation titled "Automated ETL Pipeline to Generate Financial Report at MonthEnd & Year-End" aims to enhance the efficiency and accuracy of financial reporting for the Western European Market (WEM) by automating the Extract, Transform, Load (ETL) process. The project successfully implemented an ETL pipeline that integrates multiple source systems and databases, including PostgreSQL, Microsoft SQL, and Amazon DynamoDB, into a cohesive data warehouse using AWS Pipeline and IICS mappings. This architecture supports the generation of detailed financial reports related to policies, claims, and sales, significantly reducing manual effort and operational costs.
The ETL pipeline's design ensures data integrity and consistency through structured transformation processes, including the use of various data transformation techniques and the maintenance of different data layers such as staging, operational data store (ODS), and batch master tables. The project also developed Python scripts and IICS mappings to facilitate the automatic generation of monthly and yearly financial reports, which are then placed in a shared location for easy client access.
The project's success is evident in its ability to consolidate data from diverse sources, streamline the reporting process, and provide accurate and timely financial insights. This automated approach not only improves productivity and service quality but also enables the organization to scale its resources more efficiently to meet business demands. Overall, the dissertation demonstrates a robust and scalable solution for automated financial reporting, setting a precedent for similar initiatives in the future.
References
- Jennifer Wu, Doina Bein, Jidong Huang, and Sudarshan Kurwadkar (2023). ETL and ML Forecasting Modeling Process Automation System. In Human Factors in Software and Systems Engineering, Vol. 94, 2023, 104–110. AHFE International.
- Phuong Pham (2020). A CASE STUDY IN DEVELOPING AN AUTOMATED ETL SOLUTION - Concept and Implementation. Bachelor’s thesis, Information and Communications Technology. TURKU UNIVERSITY OF APPLIED SCIENCES.
- Neepa Biswas, Anindita Sarkar Mondal, Ari Kusumastuti, Swati Saha, Kartick Chandra Mondal (31 December 2022). Automated credit assessment framework using ETL process and machine learning. Innovations in Systems and Software Engineering. Springer-Verlag London Ltd., part of Springer Nature 2022.
- Suzanne McCarthy, Andrew McCarren, Mark Roantree (October 2019). A Method for Automated Transformation and Validation of Online Datasets. 23rd Enterprise Computing Conference (EDOC), Paris, France. Volume . ISBN: .IEEE.
- Abderrahmane Sadiq, Abdelaziz El Fazziki and Mohamed Sadgal (2014). An Agent Based Etl System: Towards an Automatic Code Generation. World Applied Sciences Journal 31 (5): 979-987, 2014. ISSN 1818-4952. IDOSI Publications, 2014.
- Fahmi Bargui, Hanêne Ben-Abdallah & Jamel Feki (4 April 2016) A natural language based approach for a semi-automatic data mart design and ETL generation, Journal of Decision Systems, 25, 309344, DOI: 10.1080/12460125.2016.1158066. Paper link