Alibaba Stock Price Prediction Using Time Series Models

Overview
Predicting stock prices is an exciting challenge that involves analyzing historical data and utilizing different models to forecast future trends. In this project, I attempt to predict Alibaba Group's stock prices using a variety of time series models, including ARIMA, SARIMA, LSTM, and RNN. The goal is to explore which models can best predict future stock prices using historical data collected from Yahoo Finance.
What You’ll Learn
In this blog, I will discuss:
- How to handle and prepare stock price data for modeling.
- The importance of different time series models in stock prediction.
- A comparison of traditional statistical models (ARIMA, SARIMA) versus modern deep learning models (LSTM, RNN).
- How to evaluate model performance using key metrics like MAE and RMSE.
Dataset
I used a publicly available dataset that contains Alibaba's stock prices spanning from 2014 to 2025. This dataset is sourced from Kaggle and provides the necessary historical data for training and testing the models.
- Dataset Source: Alibaba Stock Dataset - Kaggle (Link to dataset)
Key Terms Explained
1. Time Series Analysis
Time series analysis involves statistical techniques to model and predict data points indexed in time order. Stock prices are classic examples of time series data, where each price is associated with a specific point in time.
2. ARIMA (Auto-Regressive Integrated Moving Average)
ARIMA is a classical statistical model used for time series forecasting. It combines three components:
- AR (Auto-Regressive): This part uses past values to predict future values.
- I (Integrated): Involves differencing the data to make it stationary.
- MA (Moving Average): This part models the relationship between a value and residual errors from a moving average model applied to lagged observations.
ARIMA is great for data that exhibits linear patterns over time.
3. SARIMA (Seasonal ARIMA)
SARIMA is an extension of ARIMA that also considers seasonality in time series data, making it more suitable for datasets that exhibit seasonal variations (e.g., holidays, quarterly earnings).
4. LSTM (Long Short-Term Memory)
LSTM is a type of Recurrent Neural Network (RNN), designed to capture long-range dependencies in sequential data, like stock prices. Unlike traditional models, LSTM can learn from past patterns and remember important information over long periods of time.
5. RNN (Recurrent Neural Network)
RNN is a deep learning model that is particularly good for sequence prediction. It works by maintaining a "memory" of previous inputs and using that information to make predictions about future events. It's a useful model for tasks like speech recognition, language translation, and, of course, time series forecasting like stock price prediction.
6. MAE (Mean Absolute Error)
MAE is a common evaluation metric used in regression problems. It calculates the average of the absolute differences between predicted values and actual values. Lower MAE indicates better model performance.
7. RMSE (Root Mean Squared Error)
RMSE is another evaluation metric that penalizes larger errors more than MAE. It gives a better sense of how much the predicted values deviate from actual values, especially when dealing with large errors.
Steps Followed
1. Data Collection
I collected the dataset of Alibaba’s stock prices from Yahoo Finance using Pandas. This provided me with daily stock prices for the years 2014 to 2025, including features like the opening, closing, highest, and lowest prices.
2. Data Cleaning
- Handling Missing Values: Any missing data points were filled or removed to ensure data integrity.
- Removing Duplicates: Duplicate entries were removed to avoid skewing the model’s predictions.
- Data Transformation: I transformed data into a format suitable for time series analysis.
3. Exploratory Data Analysis (EDA)
I visualized the trends and behavior of Alibaba's stock prices using Matplotlib and Seaborn. This allowed me to gain insights into the data, such as detecting any long-term upward or downward trends, identifying seasonality, and spotting anomalies.
4. Model Building
I implemented four different models for stock price prediction:
- ARIMA: A classical statistical model suited for univariate time series data without seasonality.
- SARIMA: Used for datasets with seasonal patterns.
- LSTM: A deep learning model well-suited for sequential data.
- RNN: Another deep learning model that performs similarly to LSTM for sequence prediction.
5. Model Evaluation
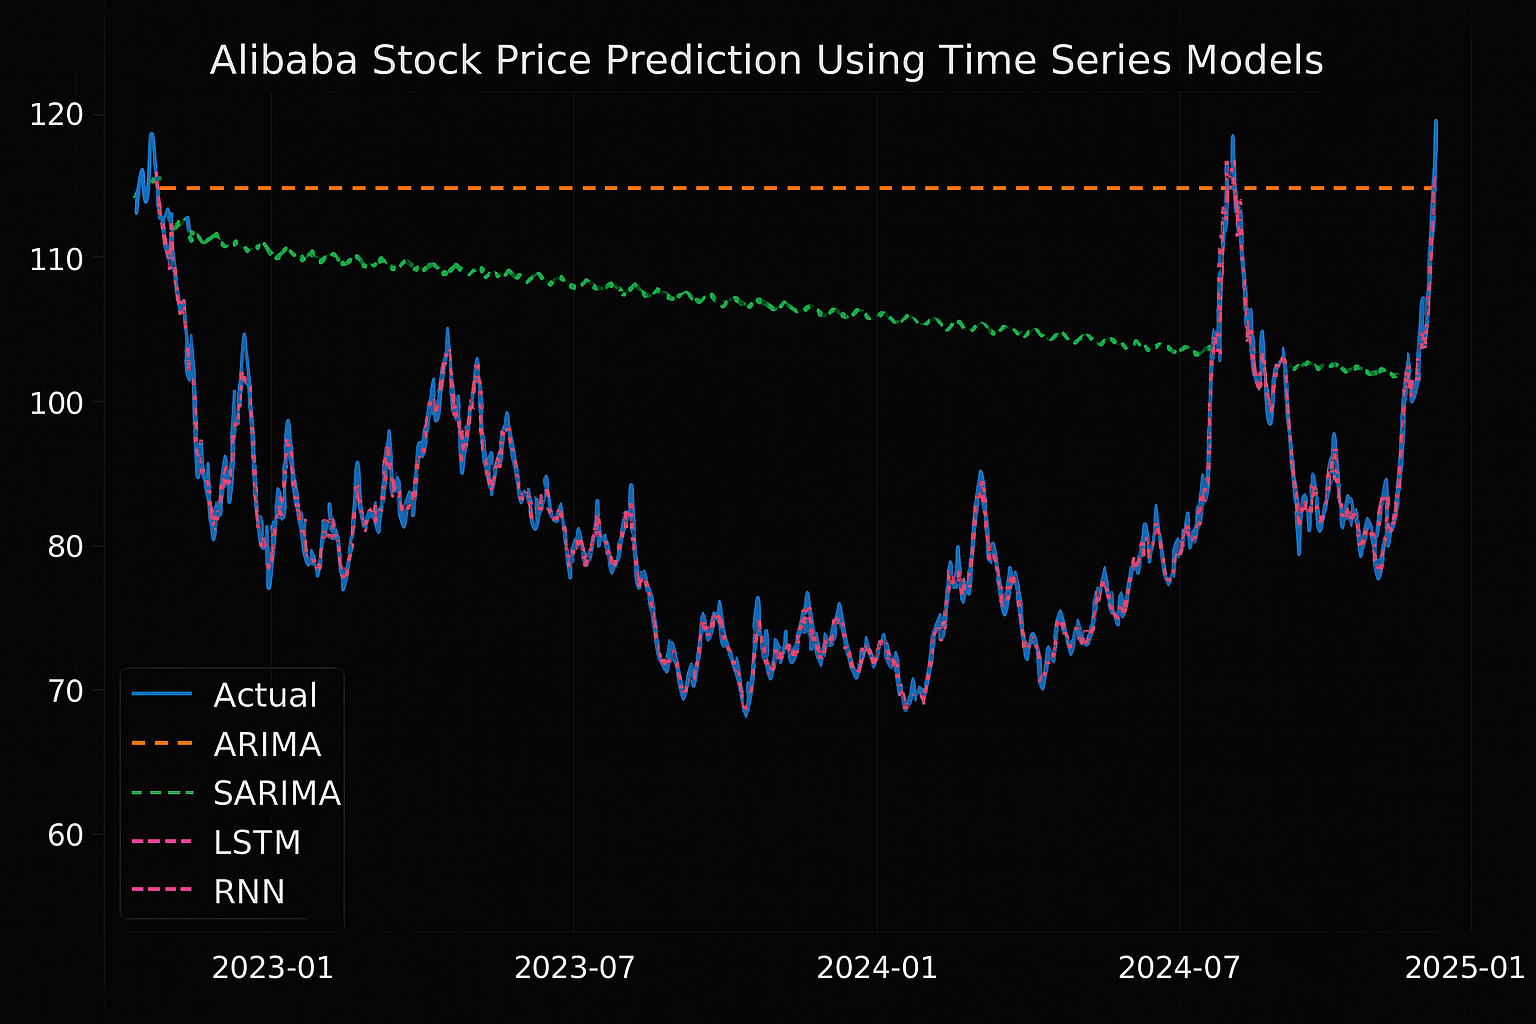
After training my models, I evaluated them using MAE and RMSE. Here are the results:
Model Performance
| Model | MAE | RMSE |
|---|---|---|
| ARIMA | 29.35 | 31.25 |
| SARIMA | 21.88 | 23.83 |
| LSTM | 2.33 | 3.30 |
| RNN | 2.05 | 2.61 |

Findings
The LSTM and RNN models performed significantly better than the traditional statistical models (ARIMA and SARIMA), with lower MAE and RMSE. This demonstrates the power of deep learning in capturing complex patterns and trends in time series data.
Technologies Used
- Python
- Pandas and NumPy
- Matplotlib and Seaborn
- Scikit-learn
- Statsmodels (ARIMA, SARIMA)
- TensorFlow and Keras (LSTM, RNN)
How to Use
Step 1: Install Required Libraries
pip install pandas numpy matplotlib seaborn scikit-learn statsmodels tensorflow
Step 2: Run the Jupyter Notebook
Download the Jupyter Notebook and run it to:
- Preprocess the Data
- Train the Models
- Evaluate the Models
Step 3: Fine-tune Hyperparameters
You can adjust the LSTM and RNN models’ hyperparameters to improve their accuracy and performance.
Future Work
- Incorporating external data sources like news sentiment or macroeconomic indicators to improve the model’s predictive power.
- Implementing more advanced models like Transformers for even better performance.
- Fine-tuning model hyperparameters to optimize results.
Contributors
- Jharana Adhikari
LinkedIn: Jharana Adhikari
License
This project is open-source and available under the MIT License.
Other Posts You Might Like:
- Time Series Forecasting: ARIMA vs. LSTM
- Introduction to Recurrent Neural Networks
- A Beginner’s Guide to Stock Market Prediction with AI
Conclusion
This project highlights the importance of combining traditional and modern machine learning techniques in stock price prediction. While classical models like ARIMA and SARIMA are effective for simpler datasets, deep learning models like LSTM and RNN have shown superior performance in capturing complex patterns in Alibaba's stock price data.