In the rapidly evolving world of machine learning, AutoML libraries have become essential tools for data scientists and machine learning engineers. These libraries automate the time-consuming process of model selection, hyperparameter tuning, and feature engineering, making it easier to develop high-performing models.
In this article, we will compare several popular AutoML libraries— AutoKeras, Auto-Sklearn, AutoGluon, H2o, FLAML, Lazy Predict, MLBox, mljar-supervised, TPOT, and PyCaret—on binary classification problems using the Ready Tensor platform.
To ensure a fair evaluation, we employed the standardized methods and Docker-based environment provided by the Ready Tensor platform. This platform ensures consistent dataset processing and benchmarking, allowing us to focus on the performance of the AutoML libraries without the influence of extraneous variables. We evaluated each library's performance on multiple datasets, using AUC (Area Under the Curve) as our primary metric, alongside training time and RAM usage as performance indicators. These metrics provide a comprehensive view of each model's ability to distinguish between classes, as well as its efficiency.
The datasets used span a variety of domains, ensuring that our results are robust and generalizable. Each library was tasked with creating a binary classification model for each dataset, and the average AUC, training time, and RAM usage were recorded.
No additional preprocessing was performed on the datasets, as the AutoML libraries are designed to handle feature engineering, data cleaning, and other preprocessing tasks automatically.
| Dataset | Industry | Observations | Features | Has Categorical Features? | Has Missing Values? | Balance Status |
|---|---|---|---|---|---|---|
| Breast Cancer - Wisconsin | Biosciences / Healthcare | 569 | 32 | no | no | Balanced |
| Concentric Spheres Dataset | None (synthetic) | 3,000 | 9 | no | yes | Balanced |
| In-vehicle coupon recommendation | E-commerce | 12,684 | 25 | yes | yes | Balanced |
| Credit Approval | Financial services | 690 | 15 | yes | yes | Balanced |
| Electrical Grid Stability Simulated Data Data Set | Energy | 10,000 | 13 | no | no | Slighly Imbalanced |
| Employee Attrition dataset from PyCaret | Miscellaneous / Human Resource | 14,999 | 9 | yes | no | Slighly Imbalanced |
| Image Segmentation | Computer Vision | 2,310 | 20 | no | no | Imbalanced |
| Mushroom Data Set | Biosciences | 8,124 | 22 | yes | yes | Balanced |
| NBA binary classification dataset from Pycaret | Sports | 1,294 | 21 | no | no | Balanced |
| Online Shoppers Purchasing Intention | E-commerce | 12,330 | 17 | yes | no | Imbalanced |
| Spambase Data Set | Technology / Internet Services | 4,601 | 57 | no | no | Balanced |
| Spiral Dataset | None (synthetic) | 250 | 2 | no | no | Balanced |
| Telco customer churn | Telecom | 7,043 | 20 | no | yes | Imbalanced |
| Titanic Passenger Survival dataset | Tourism / Transportation | 1,309 | 10 | yes | yes | Balanced |
| Exclusive-Or dataset | None (synthetic) | 6,000 | 5 | no | no | Balanced |
For more details about the dataset: https://github.com/readytensor/rt-datasets-binary-classification
In this section we recorded AUC for each model across all datasets,
ranked from left to right for overall average score:
| Dataset \ AutoML Library | AutoGluon | FLAML | TPOT | PyCaret | mljar-supervised | LazyPredict | H2O AutoML | Auto-sklearn | MLBox | AutoKeras |
|---|---|---|---|---|---|---|---|---|---|---|
| Breast Cancer - Wisconsin | 0.969 | 0.997 | 0.99 | 0.997 | 0.992 | 0.996 | 0.995 | 0.998 | 0.994 | 0.996 |
| Concentric Spheres | 0.988 | 0.993 | 0.99 | 0.986 | 0.991 | 0.986 | 0.994 | 0.984 | 0.994 | 0.983 |
| In-vehicle coupon recommendation | 0.844 | 0.836 | 0.792 | 0.826 | 0.835 | 0.805 | 0.831 | 0.776 | 0.823 | 0.73 |
| Credit Approval | 0.986 | 0.918 | 0.893 | 0.907 | 0.919 | 0.845 | 0.913 | 0.892 | 0.902 | 0.857 |
| Electrical Grid Stability Simulated Data | 0.995 | 0.992 | 0.996 | 0.995 | 0.989 | 0.994 | 0.987 | 0.972 | 0.986 | 0.99 |
| Employee Attrition dataset from PyCaret | 1 | 0.991 | 0.991 | 0.99 | 0.991 | 0.99 | 0.99 | 0.991 | 0.992 | 0.737 |
| Image Segmentation | 1 | 1 | 1 | 1 | 0.983 | 0.999 | 0.996 | 1 | 0.991 | 1 |
| Mushroom | 1 | 1 | 1 | 1 | 1 | 1 | 1 | 1 | 1 | 1 |
| NBA binary classification from Pycaret | 0.769 | 0.746 | 0.768 | 0.765 | 0.727 | 0.759 | 0.764 | 0.729 | 0.768 | 0.745 |
| Online Shoppers Purchasing Intention | 0.926 | 0.932 | 0.922 | 0.92 | 0.929 | 0.918 | 0.928 | 0.933 | 0.931 | 0.903 |
| Spambase | 1 | 0.984 | 0.988 | 0.986 | 0.986 | 0.986 | 0.988 | 0.986 | 0.988 | 0.972 |
| Spiral | 0.998 | 0.987 | 1 | 0.916 | 0.881 | 0.899 | 0.896 | 0.931 | 0.765 | 0.502 |
| Telco customer churn | 0.862 | 0.856 | 0.841 | 0.862 | 0.846 | 0.862 | 0.866 | 0.859 | 0.863 | 0.838 |
| Titanic Passenger Survival | 0.86 | 0.866 | 0.852 | 0.861 | 0.859 | 0.868 | 0.855 | 0.81 | 0.864 | 0.772 |
| Exclusive-Or | 0.962 | 0.994 | 0.97 | 0.955 | 0.972 | 0.94 | 0.778 | 0.915 | 0.487 | 0.59 |
| Average AUC over all the datasets | 0.944 | 0.939 | 0.933 | 0.931 | 0.927 | 0.923 | 0.919 | 0.918 | 0.89 | 0.841 |
Most of the models produced AUC scores that were remarkably close, ranging between 0.94 and 0.92.
AutoGluon secured the top spot with the highest AUC score
Additionally, the majority of the packages demonstrated similarly close performance on imbalanced datasets, indicating their robustness and adaptability to varying data distributions.
The next two graphs further demonstrate the performance of the models regarding execution time in both training and prediction for the "In-vehicle coupon recommendation" dataset. This dataset recorded the highest execution time across all the datasets, providing a clear view of how each model performs under more time-intensive conditions.
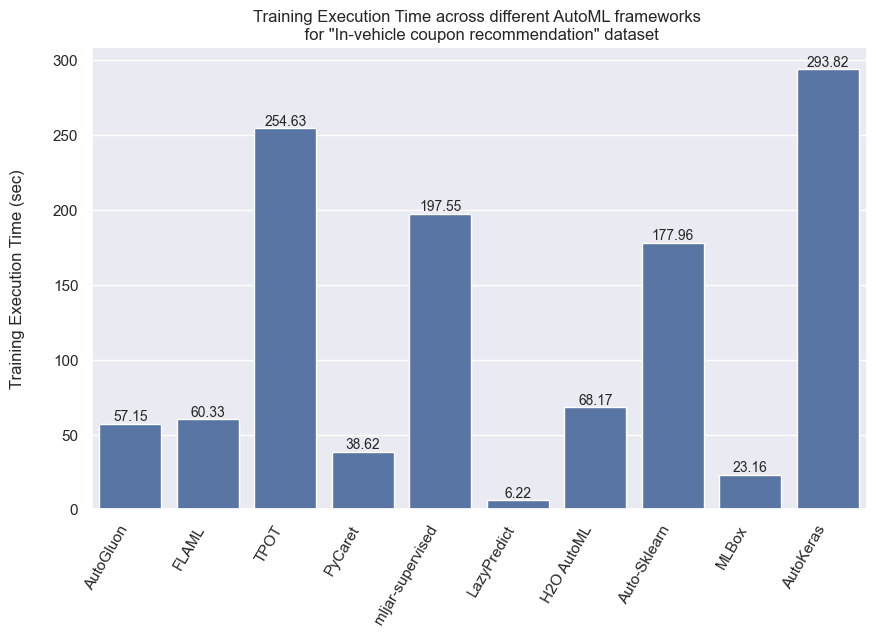
Lazy Predict scores the lowest training execution time, meanwhile AutoKeras, TPOT, mljar-supervised, Auto-Sklearn have high training execution times.
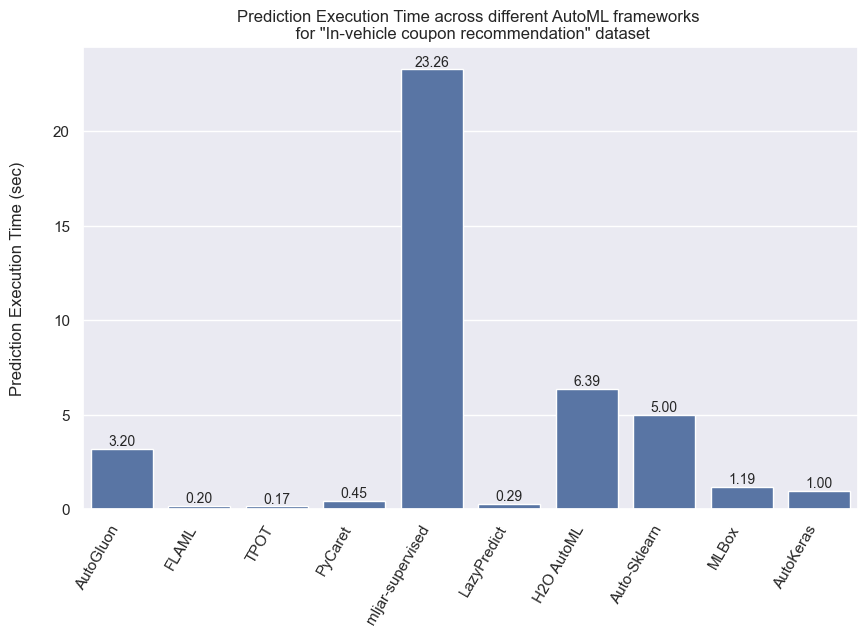
mljar-supervised by far has the highest execution time for prediction.
For more details about the execution times across all the models please check the appendix
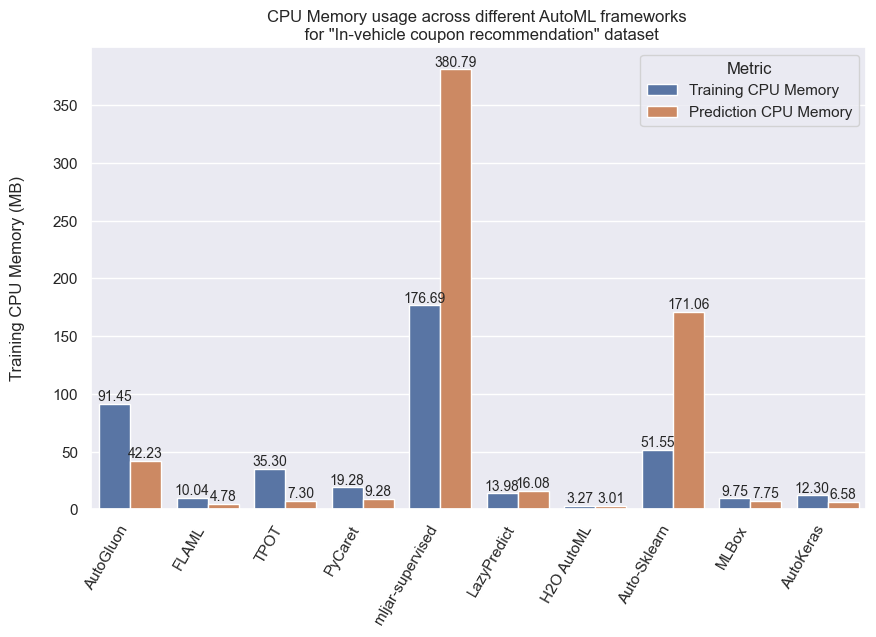
It's clear that mljar-supervised has the highest CPU memory usage
For more details about the CPU memory usages across all the models please check the appendix
While AutoML libraries promise to streamline the machine learning process, this comparison reveals that not all tools are created equal. The close AUC scores suggest that many of these libraries can effectively handle binary classification tasks, but the differences in execution time and resource consumption tell a more nuanced story.
Lazy Predict’s speed highlights its utility for rapid prototyping, yet its simplicity may not suit more complex tasks. Meanwhile, the slower prediction times of mljar-supervised might be acceptable in exchange for higher accuracy in some cases, but they could be a bottleneck in time-sensitive applications.
AutoGluon's top AUC score positions it as a strong contender for those prioritizing predictive performance, yet its resource demands may not be ideal for every scenario. The slight edge in AUC scores across most models implies that AutoML has made significant strides, but it also raises the question: Are these tools truly ready to replace the nuanced decision-making of a skilled data scientist?
In a field where every second and byte of RAM can impact performance and costs, the choice of an AutoML library must be as strategic as the problem itself. This analysis underscores the importance of balancing speed, accuracy, and resource efficiency when selecting the right tool for your specific needs. The promise of AutoML is clear, but the reality is that the choice of library can still significantly impact the success of your machine learning projects.
| Dataset \ AutoML Library | AutoGluon | FLAML | TPOT | PyCaret | mljar-supervised | LazyPredict | H2O AutoML | Auto-Sklearn | MLBox | AutoKeras | ||||||||||
|---|---|---|---|---|---|---|---|---|---|---|---|---|---|---|---|---|---|---|---|---|
| Metric | Training ET | Prediction ET | Training ET | Prediction ET | Training ET | Prediction ET | Training ET | Prediction ET | Training ET | Prediction ET | Training ET | Prediction ET | Training ET | Prediction ET | Training ET | Prediction ET | Training ET | Prediction ET | Training ET | Prediction ET |
| Breast Cancer - Wisconsin | 27.13 | 0.14 | 60.09 | 0.17 | 59.83 | 0.13 | 21.26 | 0.29 | 194.74 | 29.59 | 1.73 | 0.24 | 40.22 | 5.79 | 182.1 | 6.6 | 5.73 | 0.8 | 143.77 | 1.0 |
| Concentric Spheres Dataset | 36.91 | 5.68 | 60.3 | 0.14 | 109.92 | 0.16 | 28.86 | 0.31 | 196.64 | 20.57 | 3.85 | 0.25 | 52.44 | 5.88 | 175.48 | 1.04 | 9.41 | 0.46 | 408.55 | 0.88 |
| Credit Approval | 27.95 | 0.54 | 60.2 | 0.18 | 68.78 | 0.13 | 29.32 | 0.64 | 193.22 | 25.99 | 1.72 | 0.25 | 24.17 | 6.19 | 177.73 | 2.72 | 18.83 | 1.25 | 52.8 | 0.9 |
| Electrical Grid Stability Simulated Data Data Set | 136.32 | 5.87 | 61.66 | 0.18 | 499.87 | 0.08 | 58.92 | 0.31 | 200.16 | 19.22 | 11.66 | 0.25 | 121.8 | 6.42 | 176.23 | 4.47 | 16.11 | 0.78 | 634.69 | 0.97 |
| Employee Attrition dataset from PyCaret | 84.27 | 0.6 | 60.35 | 0.17 | 369.85 | 0.2 | 53.86 | 0.48 | 202.49 | 19.48 | 12.7 | 0.34 | 111.57 | 6.76 | 178.27 | 6.06 | 28.01 | 1.07 | 968.18 | 1.16 |
| Exclusive-Or dataset | 64.28 | 6.36 | 60.24 | 0.14 | 248.57 | 0.07 | 37.25 | 0.32 | 192.89 | 19.4 | 6.19 | 0.22 | 39.09 | 6.05 | 173.75 | 0.6 | 9.21 | 0.42 | 281.57 | 0.85 |
| Image Segmentation | 29.39 | 0.32 | 60.09 | 0.17 | 116.05 | 0.15 | 25.56 | 0.33 | 202.42 | 21.62 | 2.81 | 0.23 | 73.3 | 5.97 | 177.6 | 6.15 | 11.77 | 0.67 | 285.32 | 0.93 |
| In-vehicle coupon recommendation | 160.17 | 8.11 | 60.79 | 0.31 | 530.31 | 0.39 | 80.8 | 0.86 | 195.02 | 17.82 | 19.37 | 0.6 | 94.35 | 8.36 | 182.46 | 7.07 | 77.49 | 4.01 | 273.01 | 1.27 |
| Mushroom Data Set | 80.05 | 0.38 | 60.18 | 0.2 | 157.03 | 0.16 | 54.11 | 0.73 | 197.1 | 20.67 | 5.2 | 0.42 | 204.96 | 7.37 | 179.83 | 9.53 | 59.15 | 2.86 | 244.23 | 1.23 |
| NBA binary classification dataset from Pycaret | 25.71 | 6.17 | 60.13 | 0.17 | 98.32 | 0.16 | 22.44 | 0.29 | 198.42 | 21.25 | 2.16 | 0.23 | 32.71 | 6.03 | 175.21 | 0.7 | 6.86 | 0.55 | 118.38 | 0.85 |
| Online Shoppers Purchasing Intention | 70.14 | 2.06 | 60.14 | 0.27 | 789.96 | 0.26 | 54.19 | 0.51 | 196.91 | 19.94 | 13.72 | 0.41 | 75.47 | 6.86 | 178.55 | 5.49 | 51.66 | 2.1 | 494.98 | 1.32 |
| Spambase Data Set | 41.47 | 0.52 | 60.2 | 0.25 | 576.36 | 0.23 | 35.75 | 0.4 | 201.19 | 21.2 | 6.08 | 0.33 | 95.22 | 6.35 | 177.45 | 6.78 | 19.78 | 1.53 | 148.28 | 1.14 |
| Spiral Dataset | 25.61 | 0.1 | 60.6 | 0.33 | 29.57 | 0.05 | 18.57 | 0.28 | 197.72 | 36.01 | 0.91 | 0.17 | 19.31 | 5.66 | 178.1 | 5.54 | 2.77 | 0.26 | 65.73 | 0.79 |
| Telco customer churn | 48.07 | 6.51 | 60.13 | 0.19 | 330.72 | 0.27 | 51.61 | 0.68 | 194.87 | 19.78 | 8.52 | 0.33 | 58.81 | 6.89 | 183.17 | 4.26 | 38.0 | 1.41 | 256.81 | 0.99 |
| Titanic Passenger Survival dataset | 31.11 | 2.14 | 60.08 | 0.17 | 46.37 | 0.1 | 24.4 | 0.41 | 202.03 | 22.25 | 1.91 | 0.21 | 25.89 | 5.86 | 176.09 | 6.55 | 10.96 | 0.46 | 178.77 | 0.89 |
| Average | 59.24 | 3.03 | 60.35 | 0.2 | 268.77 | 0.17 | 39.79 | 0.46 | 197.72 | 22.32 | 6.57 | 0.3 | 71.29 | 6.43 | 178.13 | 4.9 | 24.38 | 1.24 | 303.67 | 1.01 |
| Dataset \ AutoML Library | AutoGluon | FLAML | TPOT | PyCaret | mljar-supervised | LazyPredict | H2O AutoML | Auto-Sklearn | MLBox | AutoKeras | ||||||||||
|---|---|---|---|---|---|---|---|---|---|---|---|---|---|---|---|---|---|---|---|---|
| Training CPU Mem | Prediction CPU Mem | Training CPU Mem | Prediction CPU Mem | Training CPU Mem | Prediction CPU Mem | Training CPU Mem | Prediction CPU Mem | Training CPU Mem | Prediction CPU Mem | Training CPU Mem | Prediction CPU Mem | Training CPU Mem | Prediction CPU Mem | Training CPU Mem | Prediction CPU Mem | Training CPU Mem | Prediction CPU Mem | Training CPU Mem | Prediction CPU Mem | |
| Breast Cancer - Wisconsin | 69.61 | 2.96 | 4.19 | 3.07 | 4.88 | 2.49 | 12.46 | 4.13 | 235.7 | 453.81 | 2.0 | 3.95 | 3.07 | 2.98 | 35.96 | 100.81 | 3.24 | 4.67 | 10.02 | 6.23 |
| Concentric Spheres Dataset | 75.32 | 58.47 | 7.94 | 3.16 | 4.47 | 5.82 | 13.41 | 4.58 | 157.18 | 335.87 | 2.1 | 5.47 | 3.73 | 3.78 | 17.64 | 25.99 | 4.68 | 4.07 | 9.48 | 5.88 |
| Credit Approval | 71.94 | 11.84 | 3.32 | 2.74 | 4.69 | 3.99 | 12.8 | 6.2 | 186.65 | 408.91 | 2.46 | 4.98 | 3.26 | 2.73 | 18.7 | 41.94 | 3.88 | 5.68 | 9.92 | 6.16 |
| Electrical Grid Stability Simulated Data Data Set | 118.44 | 62.26 | 11.73 | 5.92 | 7.67 | 2.54 | 15.63 | 5.1 | 150.23 | 339.96 | 5.69 | 14.94 | 3.34 | 3.18 | 72.5 | 270.72 | 8.09 | 5.41 | 11.12 | 6.27 |
| Employee Attrition dataset from PyCaret | 79.69 | 13.55 | 18.47 | 5.51 | 10.5 | 6.21 | 21.15 | 12.47 | 158.23 | 343.8 | 15.83 | 17.25 | 3.36 | 3.24 | 63.91 | 235.24 | 15.13 | 11.22 | 13.74 | 6.93 |
| Exclusive-Or dataset | 118.12 | 71.28 | 11.21 | 4.5 | 8.22 | 1.78 | 14.31 | 5.09 | 144.4 | 339.38 | 2.47 | 15.76 | 3.66 | 3.15 | 11.55 | 11.44 | 5.0 | 4.12 | 9.7 | 5.86 |
| Image Segmentation | 70.97 | 7.44 | 5.28 | 3.09 | 5.83 | 2.47 | 12.97 | 4.32 | 160.37 | 347.06 | 3.03 | 4.46 | 4.04 | 4.21 | 32.72 | 95.67 | 5.15 | 4.54 | 9.71 | 5.97 |
| In-vehicle coupon recommendation | 183.51 | 160.75 | 35.41 | 11.35 | 300.34 | 32.18 | 52.81 | 49.67 | 147.8 | 292.59 | 76.57 | 73.4 | 3.59 | 3.35 | 235.27 | 811.21 | 27.32 | 15.15 | 22.17 | 9.46 |
| Mushroom Data Set | 78.66 | 8.62 | 8.21 | 4.2 | 158.0 | 3.44 | 37.05 | 9.73 | 158.49 | 337.16 | 49.03 | 26.64 | 1.57 | 1.51 | 59.87 | 160.75 | 15.2 | 10.35 | 17.36 | 7.54 |
| NBA binary classification dataset from Pycaret | 73.93 | 69.95 | 4.71 | 3.15 | 4.72 | 6.87 | 12.88 | 4.19 | 154.63 | 335.97 | 2.19 | 5.99 | 3.59 | 3.08 | 11.47 | 10.94 | 4.18 | 4.34 | 9.45 | 5.87 |
| Online Shoppers Purchasing Intention | 117.25 | 33.54 | 15.53 | 6.77 | 18.42 | 20.03 | 22.89 | 17.72 | 149.84 | 343.59 | 29.59 | 32.92 | 3.47 | 3.27 | 65.39 | 271.13 | 26.99 | 23.75 | 18.65 | 8.18 |
| Spambase Data Set | 81.78 | 12.15 | 16.0 | 6.31 | 10.67 | 7.34 | 20.96 | 5.69 | 162.84 | 346.17 | 12.19 | 12.56 | 4.01 | 3.31 | 56.79 | 224.29 | 15.08 | 11.14 | 13.24 | 6.7 |
| Spiral Dataset | 69.99 | 1.66 | 3.35 | 5.97 | 3.7 | 1.33 | 12.85 | 4.6 | 268.4 | 541.23 | 1.39 | 3.59 | 1.75 | 1.56 | 31.58 | 88.57 | 2.51 | 2.97 | 9.05 | 5.73 |
| Telco customer churn | 113.11 | 62.06 | 7.64 | 4.06 | 14.04 | 14.53 | 20.72 | 5.82 | 151.79 | 335.25 | 15.61 | 25.49 | 3.87 | 3.31 | 45.66 | 161.35 | 12.92 | 9.13 | 14.25 | 6.62 |
| Titanic Passenger Survival dataset | 71.44 | 41.16 | 4.0 | 3.05 | 4.77 | 3.89 | 12.92 | 4.59 | 164.03 | 351.83 | 2.04 | 6.43 | 3.5 | 3.46 | 35.2 | 140.94 | 4.23 | 4.17 | 9.85 | 6.16 |
| Average | 92.92 | 41.18 | 10.47 | 4.86 | 37.39 | 7.66 | 19.72 | 9.59 | 170.04 | 363.51 | 14.81 | 16.92 | 3.32 | 3.07 | 52.95 | 176.73 | 10.24 | 8.05 | 12.51 | 6.64 |
