Overview 📜
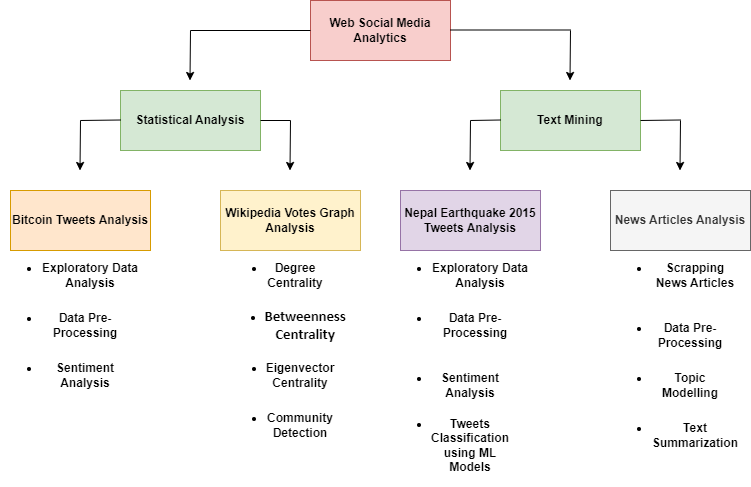
Showcasing my exploration of web social media analytics. Through this project, I've delved into Twitter analytics, sentiment analysis, graph analytics, classification ML models, news API-based topic modeling, and text summarization. Join me as we unravel the hidden narratives within the digital chatter.

Bitcoin Tweet Analysis
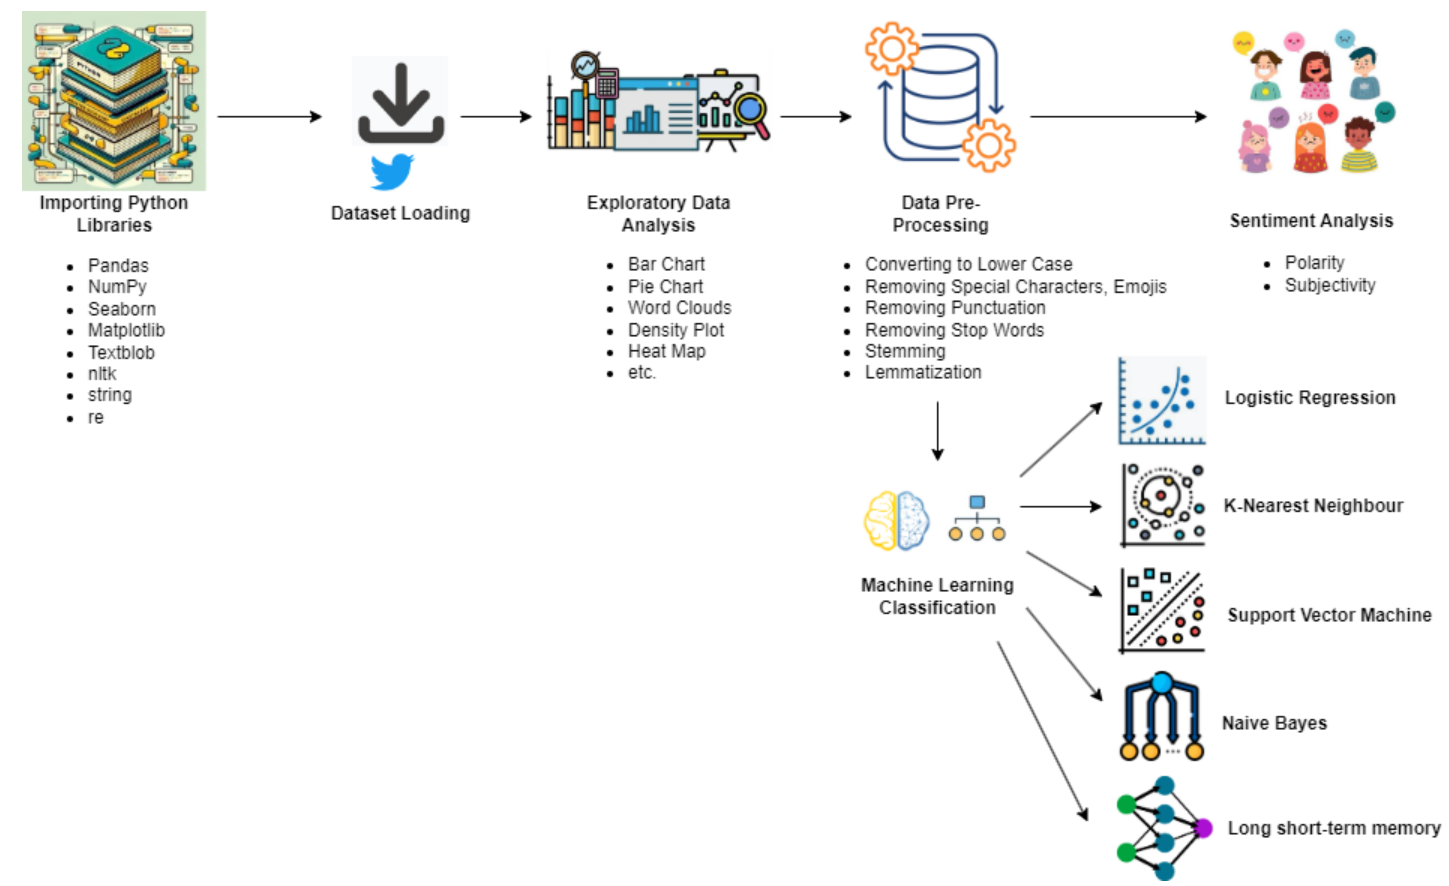
The flow chart outlines the process of working with data in Python, particularly for sentiment analysis tasks. The process begins with importing the necessary libraries, including Pandas, NumPy, Seaborn, Matplotlib, Textblob, and others for data manipulation and analysis. After loading the dataset, exploratory data analysis and data pre-processing are performed, which include converting text to lower case, removing special characters, punctuation, and stop words, and performing stemming and lemmatization. Sentiment analysis is then conducted using polarity and subjectivity measures. Visualizations such as bar charts, pie charts, word clouds, density plots, and heat maps can be used to better understand the data and the results.

Wiki-Votes Graph Analytics
The flow provided in the context pertains to network analysis using Python and its libraries. It starts with importing Python modules and libraries, followed by loading a dataset for analysis. Centrality measures such as degree centrality, betweenness centrality, and eigenvector centrality are then calculated to evaluate the importance of nodes within the network. Community detection is performed to identify clusters or groups of nodes that are more closely related to each other than to nodes in other clusters. The libraries mentioned include Pandas for data manipulation, NumPy for numerical computations, Seaborn and Matplotlib for data visualization, Random for generating random numbers, and NetworkX for creating and manipulating complex networks, including functions for calculating centrality measures and community detection. The overall goal is to analyze and understand the structure and behavior of networks using these tools and techniques.

Nepal Earthquake 2015 Tweet Analysis
This flowchart outlines a Python-based process for analyzing tweets data using libraries such as Pandas, NumPy, Seaborn, Matplotlib, Textblob, nltk, string, and re. It begins with importing necessary libraries and loading the dataset. Exploratory data analysis follows, including bar charts, pie charts, and word clouds for initial insights. Data pre-processing involves converting text to lowercase, removing special characters, emojis, and punctuation. Sentiment analysis determines text polarity (positive/negative) and subjectivity (opinion/factual). A density plot visualizes sentiment score distribution. Stop words are removed, and stemming or lemmatization reduces words to their base forms. Machine learning classification algorithms like logistic regression, K-nearest neighbors, support vector machine, LSTM or Naive Bayes are employed for text classification.

News Article Analysis and Text Summarization
The flowchart appears to be a process for News text data analysis using Python and various libraries. It begins with importing necessary libraries such as Pandas, NumPy, Matplotlib, Textblob, nitk, newspaper, request, Sklearn, and Gensim, followed by news scraping and data pre-processing tasks like removing special characters, punctuation, stop words, stemming, and lemmatization. Then, the text data is vectorized using TFIDF vectorization. After that, topic modeling is performed using LSI and LDA models, and coherence and perplexity scores are calculated to evaluate the quality of the generated topics. This process is likely used for analyzing and gaining insights from large collections of text data, such as news articles or social media posts. In the end, text summarization was performed on a news article.
