Superstore Sales Analysis and Prediction 🛒📈
Overview
The Superstore Sales Analysis and Prediction project aims to analyze sales data from a fictional superstore and build predictive models to forecast future sales. This project utilizes Python libraries for data analysis and visualization, such as Pandas, Matplotlib, and Seaborn, along with machine learning models from Scikit-learn.
Table of Contents
- Project Description
- Installation
- Data Source
- Data Analysis
- Data Visualization
- Model Building
- Results
- Conclusion
- License
Project Description
This project involves:
- Exploring and cleaning the dataset to ensure data quality.
- Performing exploratory data analysis (EDA) to uncover trends and insights.
- Visualizing sales trends, including seasonal patterns and product performance.
- Building predictive models to forecast future sales based on historical data.
Installation 🛠️
To run this project, you'll need to install the following dependencies:
pip install pandas matplotlib seaborn scikit-learn
Data Source 📊
The dataset used for this analysis is sourced from the Superstore dataset, which contains information about sales transactions, customer demographics, and product details.
Data Analysis 🔍
Data Cleaning: The dataset was cleaned to handle missing values and incorrect data types.
Exploratory Data Analysis (EDA): Key metrics were analyzed, including total sales, profit, and quantity sold by category, region, and shipping mode.
Data Visualization 📈
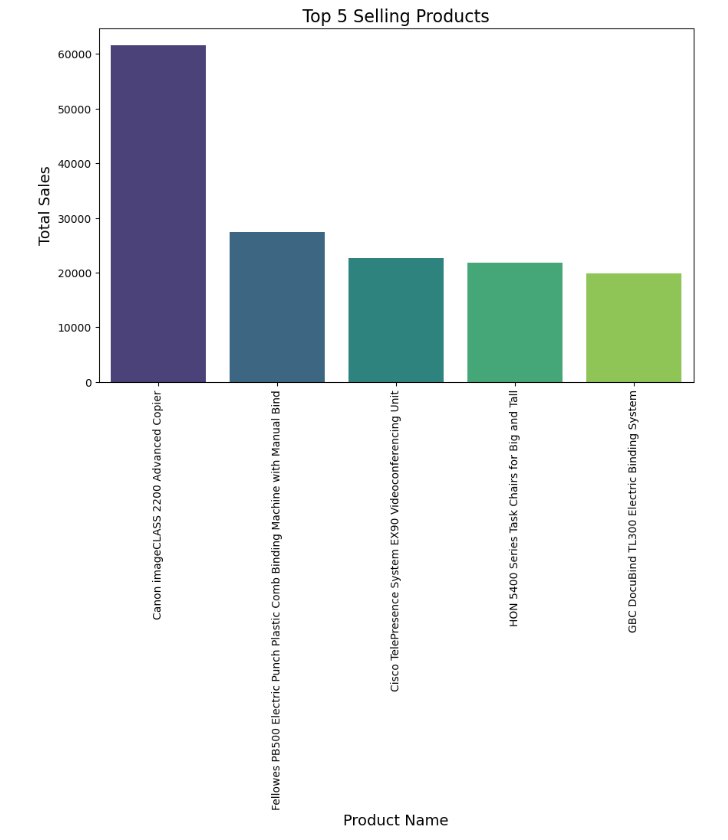
Top 5 selling products
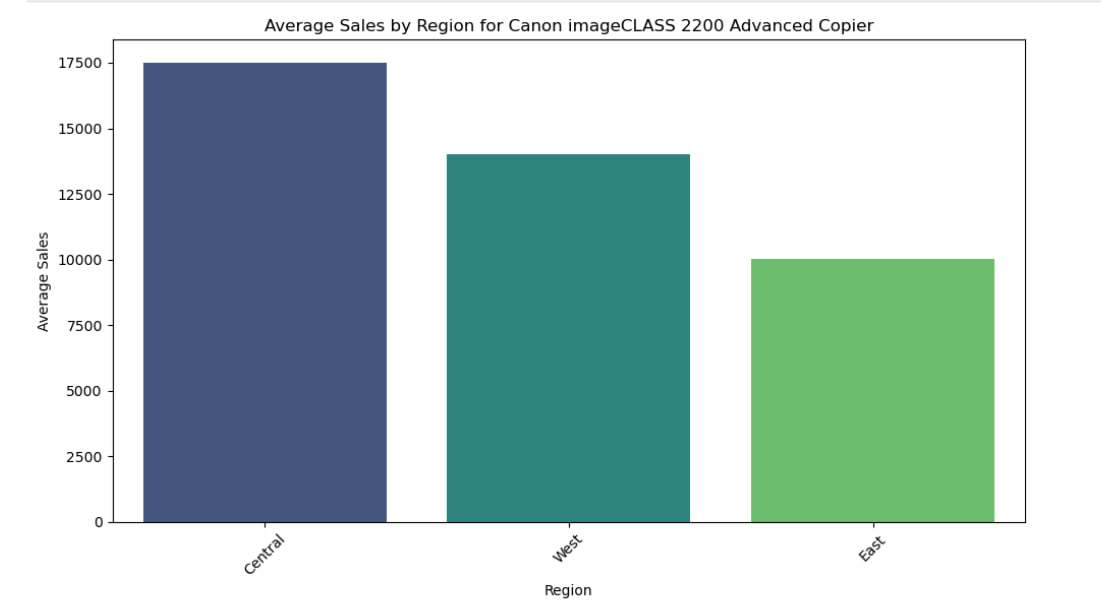
Average Sales by Region for canon product
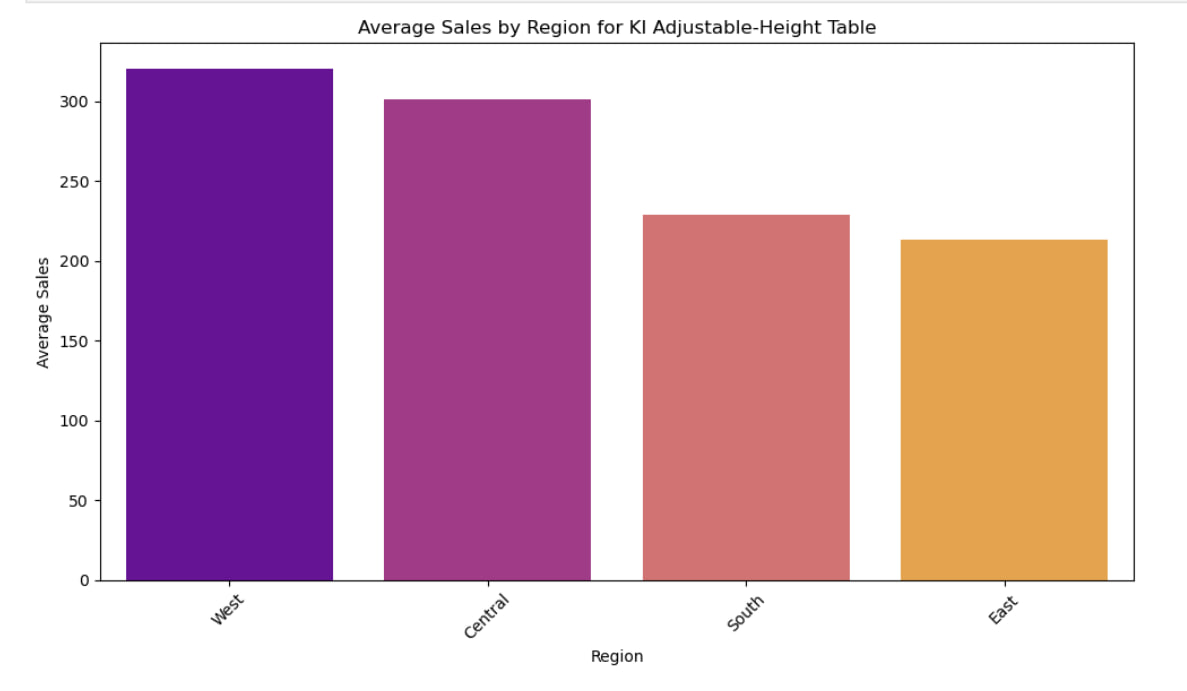
Average Sales by Region for KI product
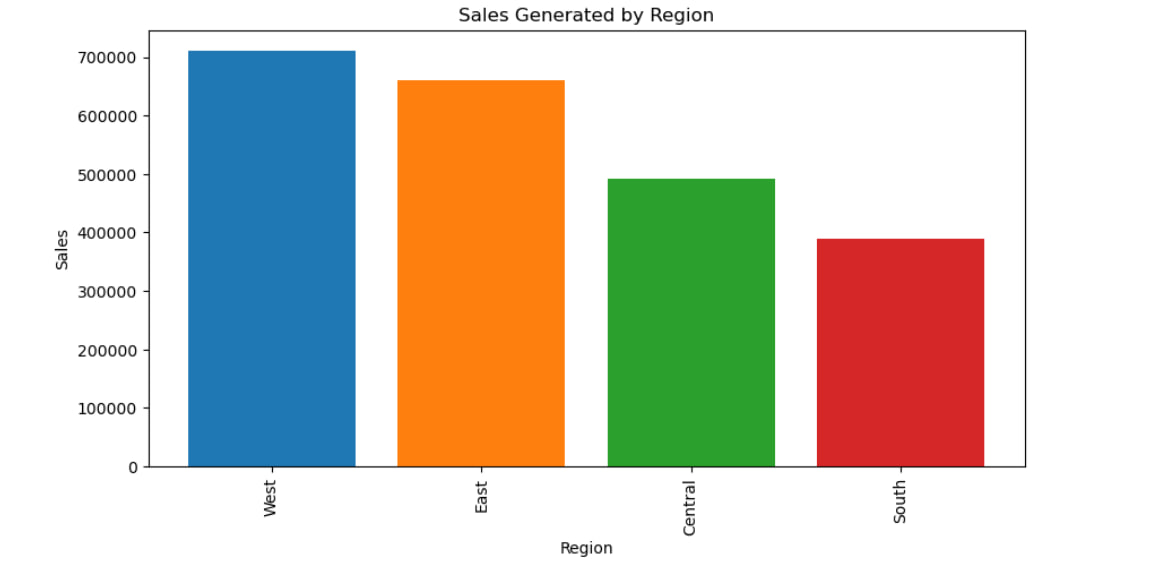
Which region & place generate the most sales?
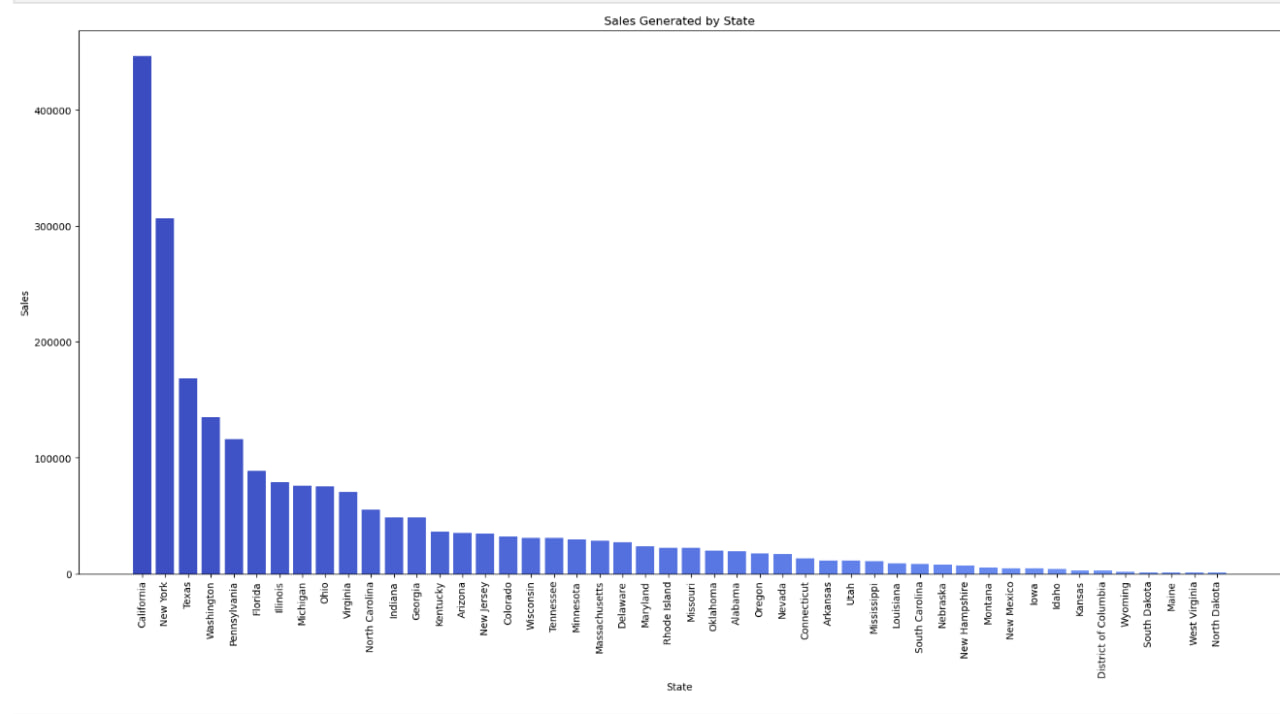
Sales Generated by state
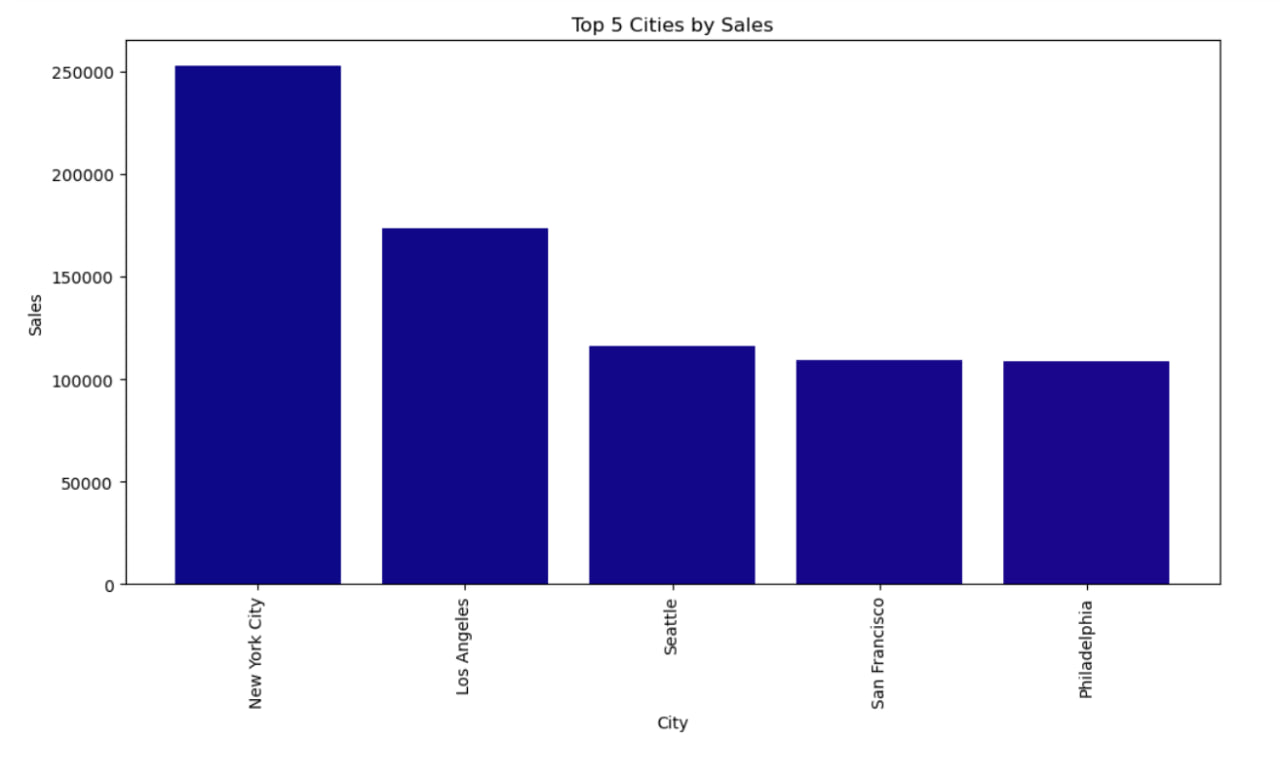
Top 5 Cities by sales
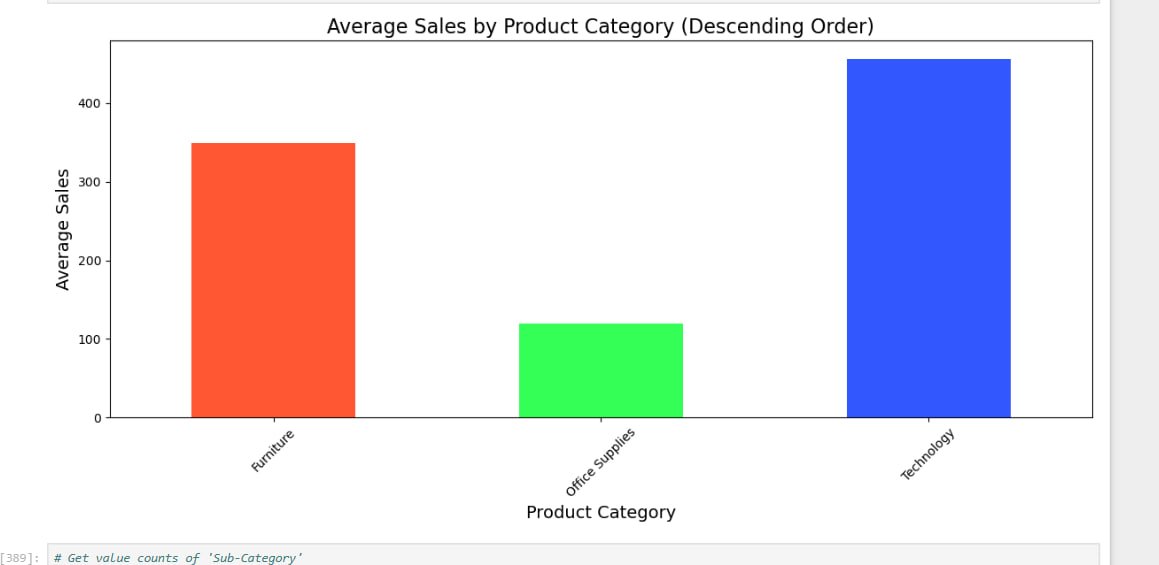
Average Sales by Product
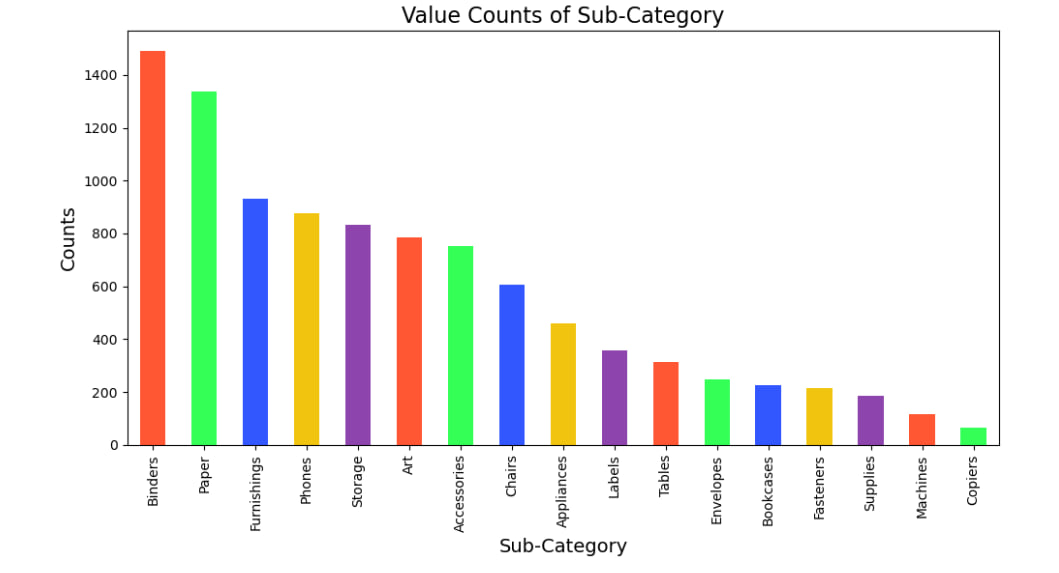
Value Count of SubCategor
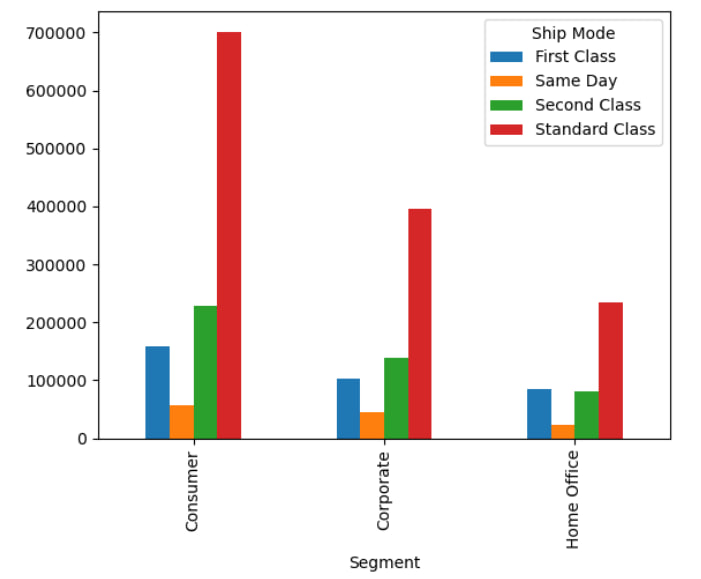
distrubution of ship mode on customers , corporate and home office
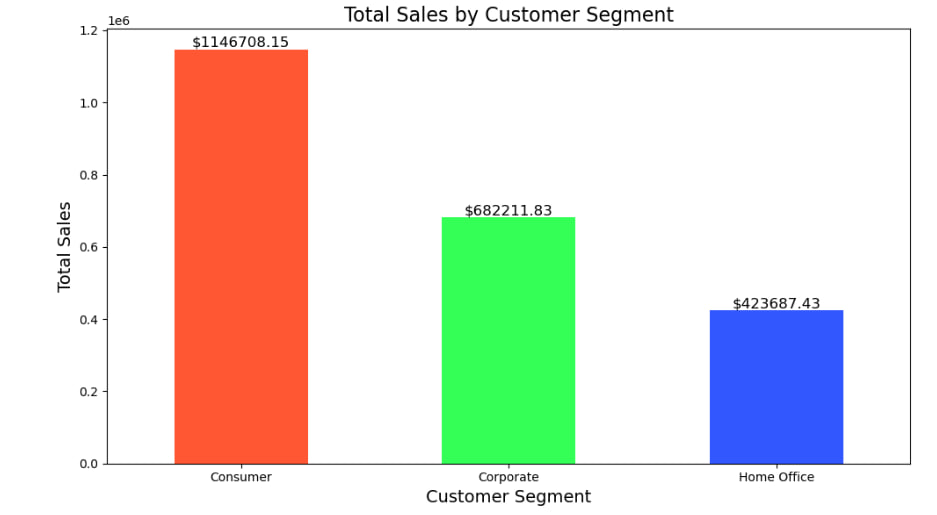
total sales by customer segment
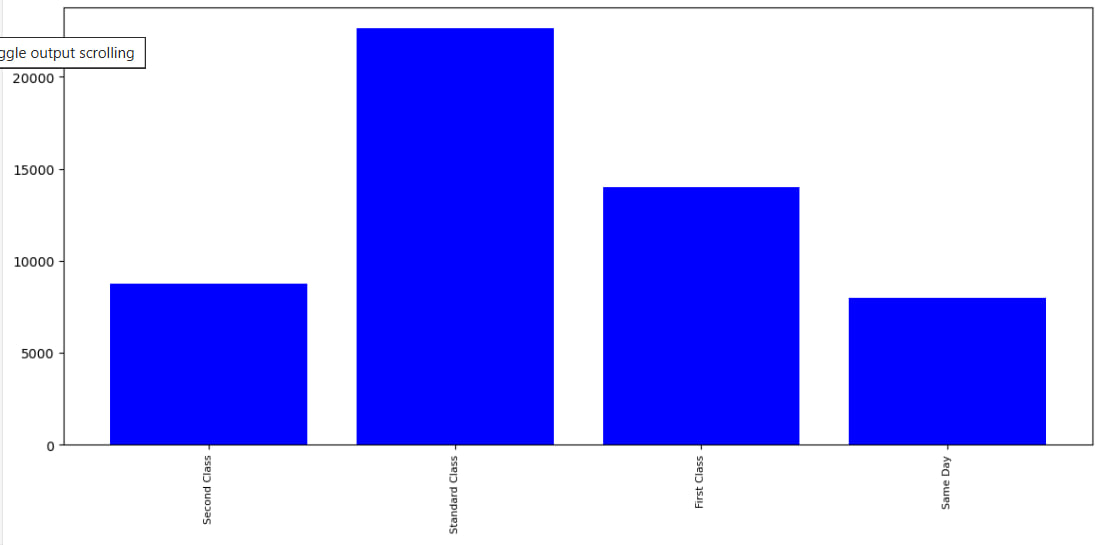
which shipping mode sold the most product
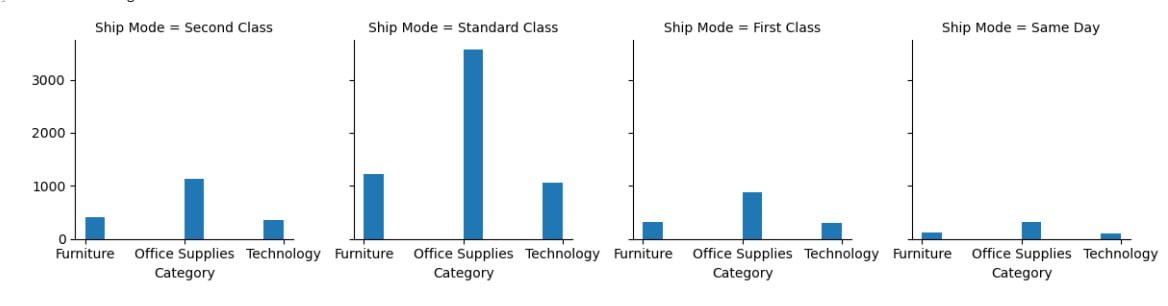
Visualize the 'Category' column from the Shipmode column dataset standpoints
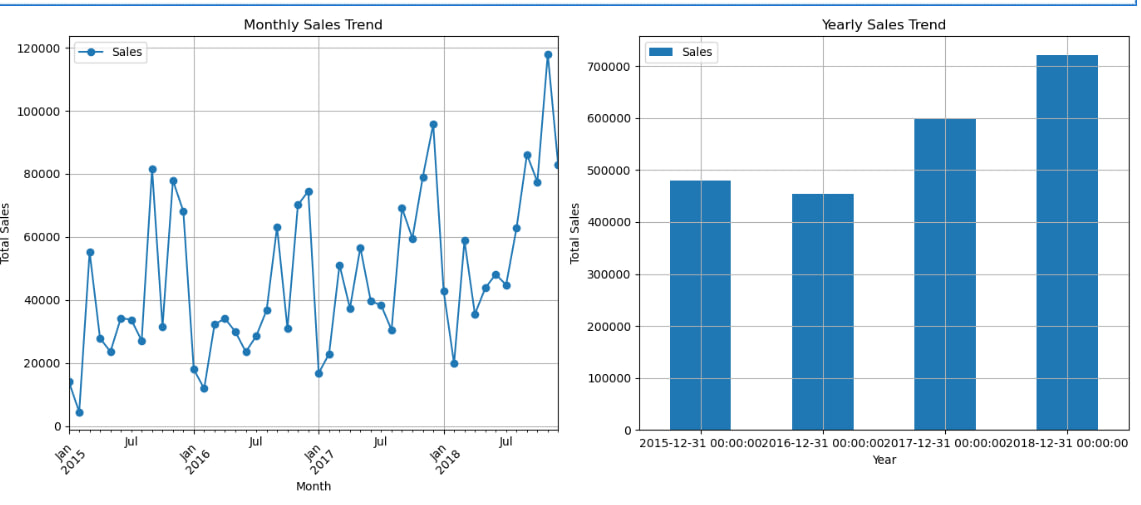
sales over monthes and years
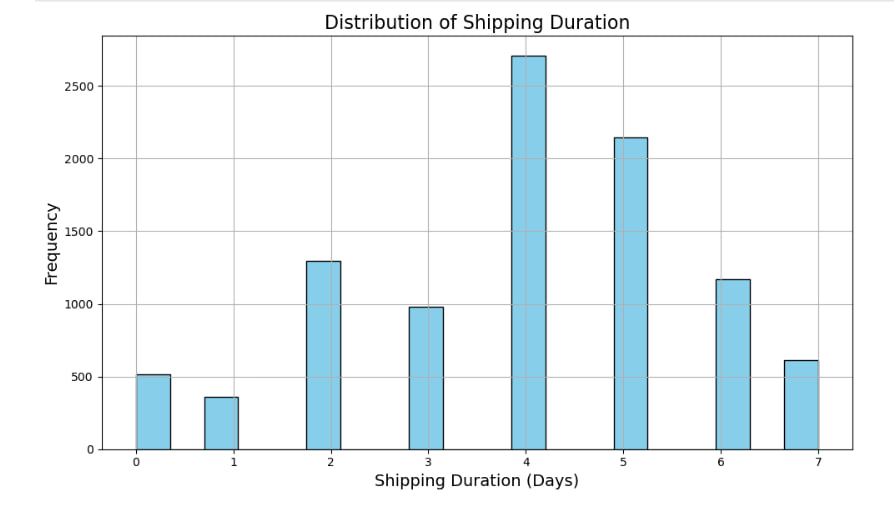
Distrubution of shipping duratoin
What is the Reason of the Delaying of Shipping Duration
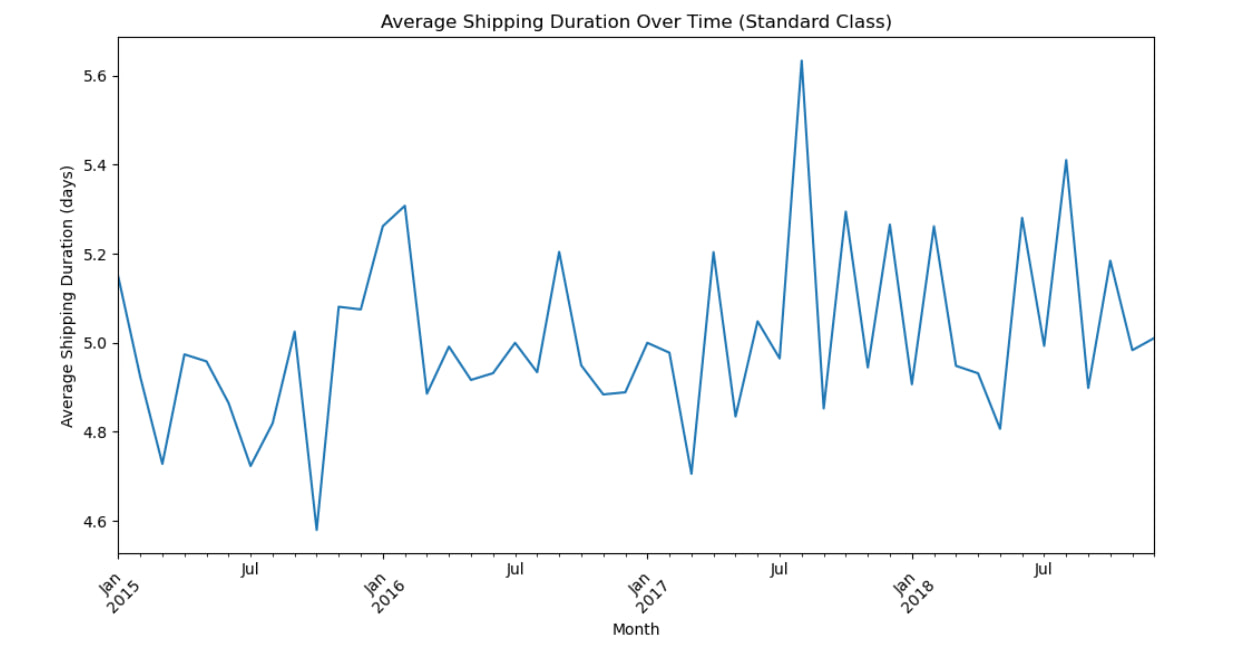
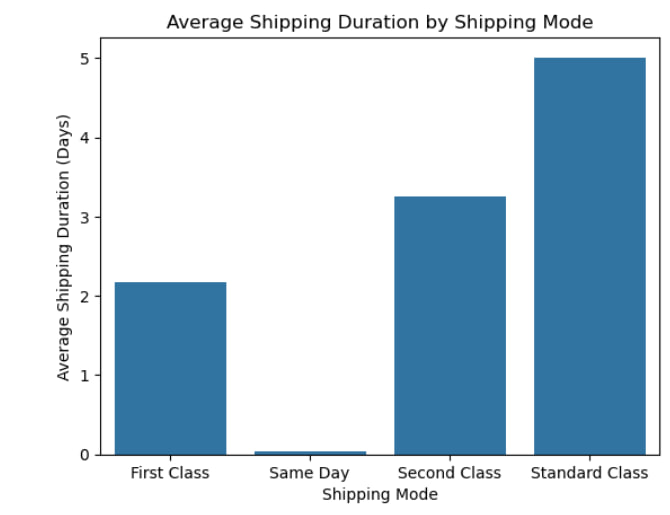
Analyzing by Shipping Mode Duration
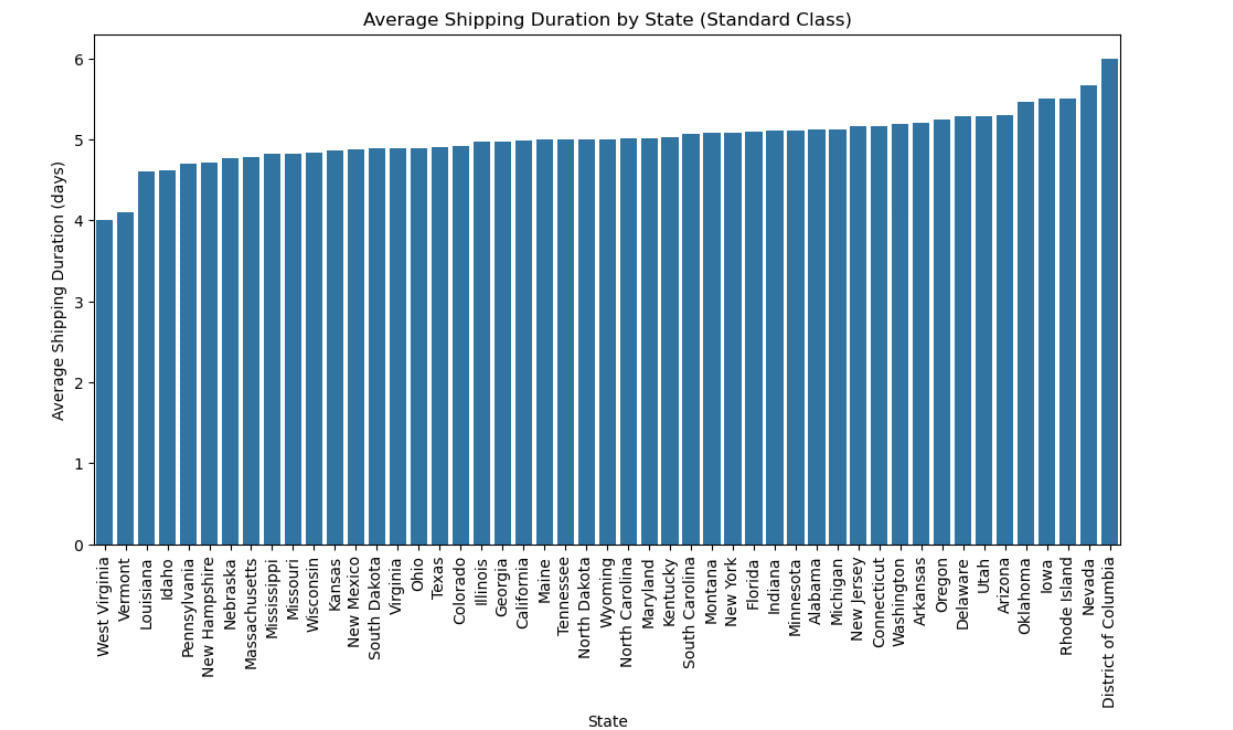
Average shipping duration by state (Standard Class)
average shipping duratoin over time
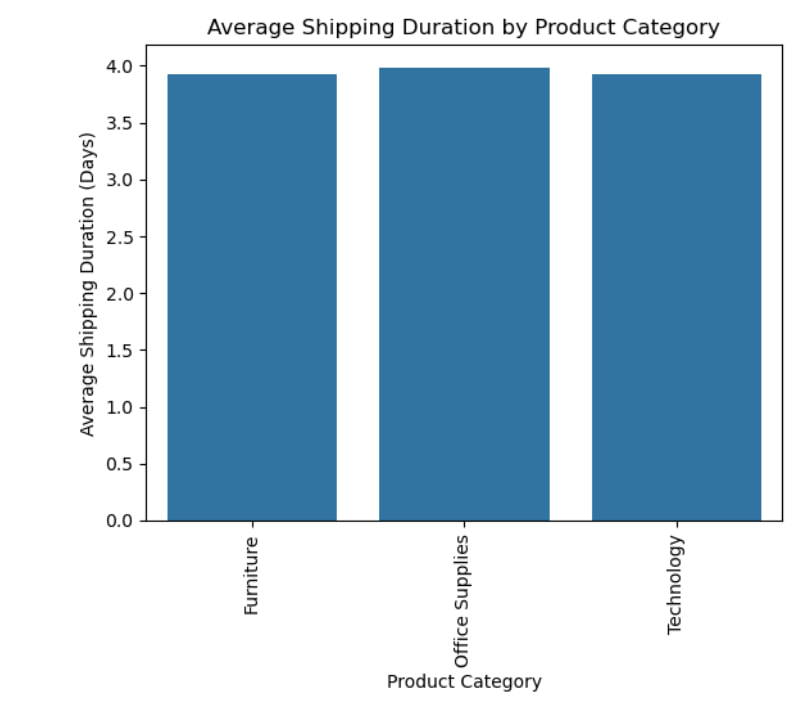
average shipping duration by product Category
Average shipping duration by state
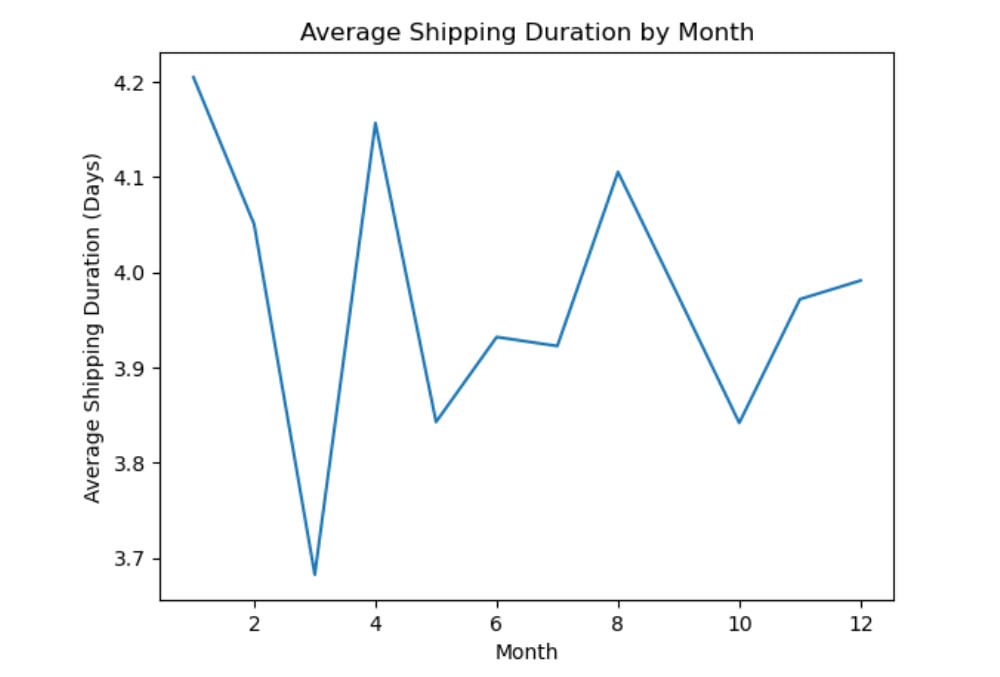
average shipping duration by month
average shipping duration vs. Total Sales by state
Model Building 🏗️
Multiple predictive models were built to forecast future sales, including:
Linear Regression: A baseline model to understand relationships between features and sales.
Decision Tree Regressor: To capture non-linear relationships in the data.
Random Forest Regressor: To improve prediction accuracy by averaging multiple decision trees.
Model Evaluation
Each model's performance was evaluated using metrics such as Mean Absolute Error (MAE) and R-squared (R²).
Results 🏆
The best-performing model achieved an R² score of on the validation set, indicating a strong ability to predict sales based on historical data.