Abstract
Brain tumors pose a significant health challenge, requiring precise and timely diagnosis to improve treatment outcomes. This study presents a deep learning-based approach for non-invasive brain tumor detection and classification using MRI data. By leveraging Convolutional Neural Networks (CNNs) and transfer learning models such as VGG16, Inception V3, and EfficientNet B2, the method effectively analyzes tumor features like texture, location, and shape. Using the Kaggle Brain Tumor Classification MRI dataset, the proposed model achieved superior accuracy compared to existing techniques, enhancing diagnostic efficiency while minimizing reliance on invasive procedures. This approach supports radiologists by improving diagnostic precision and streamlining clinical decision-making, contributing to reduced brain tumor-related mortality and better patient outcomes.
Introduction
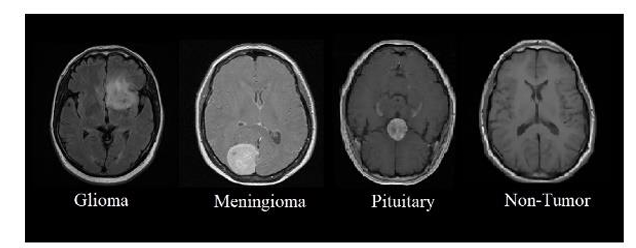
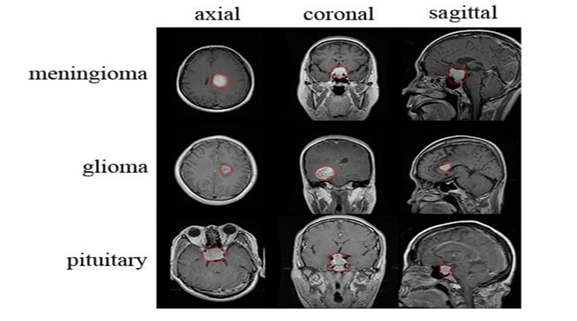
The brain, a highly complex organ with approximately 100 billion neurons and 1,000 trillion synapses, is prone to life-threatening conditions like brain tumors, caused by abnormal cell growth. In India, 28,000 cases of brain tumors are reported annually, with an alarming 86% mortality rate. Similarly, the United States anticipates 18,990 deaths from brain and CNS tumors in 2023. Brain tumors can be benign or malignant, originating either as primary tumors in the brain or secondary tumors spread from other organs. Common types include meningiomas, gliomas, and pituitary tumors, each posing severe risks due to increased intracranial pressure.
Diagnostic techniques like biopsies, MRIs, and CT scans are essential but often invasive. This study was conducted with a batch size of 32 over 10 epochs, analyzing the performance of CNN, VGG16, Inception V3, and EfficientNet B2 models. Graphs depicting accuracy and loss trends showed EfficientNet B2 achieving the highest accuracy of 97.5% with a minimal loss value of 0.13, outperforming CNN (88.0%), Inception V3 (90.2%), and VGG16 (82.2%). Confusion matrices highlighted the strengths and weaknesses of each model in classifying glioma, meningioma, no tumor, and pituitary tumor cases. EfficientNet B2 demonstrated superior classification performance and efficiency, indicating the potential of transfer learning in enhancing brain tumor detection accuracy. These findings contribute to medical image analysis, offering impactful implications for clinical diagnosis and treatment planning.
Dataset Overview
We used the publicly available Brain Tumor Detection and Classification MRI image Kaggle dataset are (https://www.kaggle.com/datasets/sartajbhuvaji/brain-tumor-classification-mri). There are 3264 brain MRI images in dataset which have been labelled as glioma tumor, meningioma tumor, no tumor and pituitary tumor. Including the number of these brain MRI images are 926 images of glioma, 937 images of meningioma, 500 images of no tumor and 901 images of pituitary tumor. The images were processed, they were divided into a training and validation set using an 80%-20% split respectively. Depending on their types and grades, brain tumor can vary in terms of size, location and shape.
Table 1. Brain Tumor classification of MRI dataset details :
| Tumor Class | Images | Format | Type |
|---|---|---|---|
| Glioma Tumor | 926 | ||
| Meningioma Tumor | 937 | ||
| Pituitary Tumor | 901 | ||
| No Tumor | 500 | ||
| Total | 3264 | JPG | Grayscale |
The dataset will be pre-processed to ensure consistency in the size and quality of the images. As they can improve the quality of the images, reduce noise, and standardize the data. We will resize the images to a standard size, typically 224 x 224 pixels, to ensure consistency in the image size across the dataset. We will also normalize the pixel values to a range of 0 to 1 to standardize the data and facilitate faster training of the models. We will convert the images to grayscale or RGB depending on the requirements of the pre-trained models.
Related work
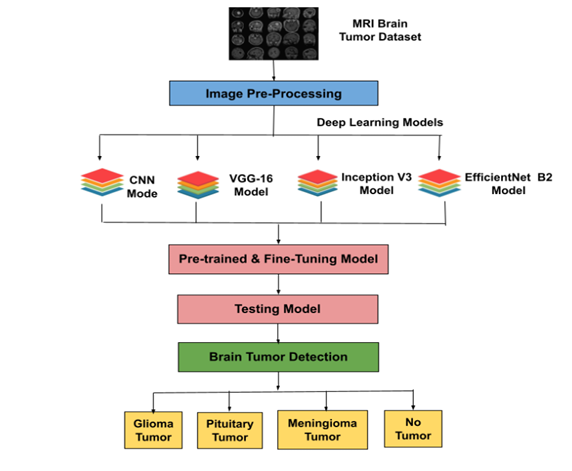
The proposed method aims to develop a brain tumor detection system using CNN and transfer learning with VGG16, Inception V3, and EfficientNet B2 models on a publicly available MRI dataset of glioma, meningioma, and pituitary tumors. The dataset will be split into training and testing sets, with image pre-processing for consistency. The models will be fine-tuned using transfer learning, and performance will be evaluated using accuracy, precision, recall, and F1 score. The best-performing model will be deployed to assist radiologists in accurate tumor diagnosis.
CNN Network Architecture:
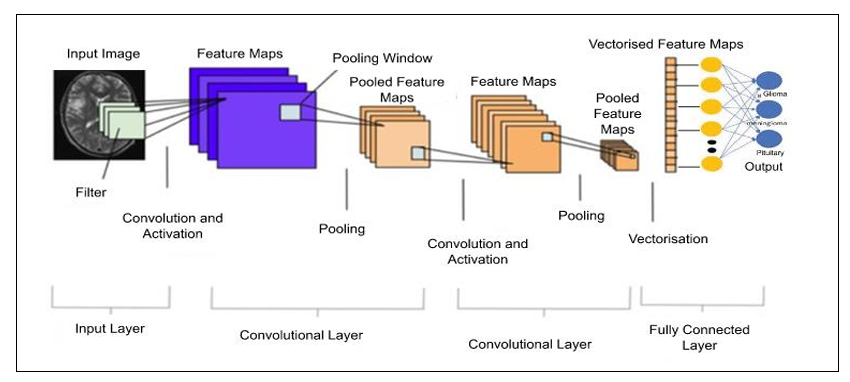
A Convolutional Neural Network (CNN) is a deep learning neural network that is commonly used for image classification, object detection, and other computer vision tasks. The architecture of a typical CNN consists of several layers, each with a specific purpose in the process of recognizing and classifying images. The basic building blocks of a CNN are Input Layer. Convolutional Layers, Pooling Layers, and Fully Connected Layers and Output layers.
VGG-16
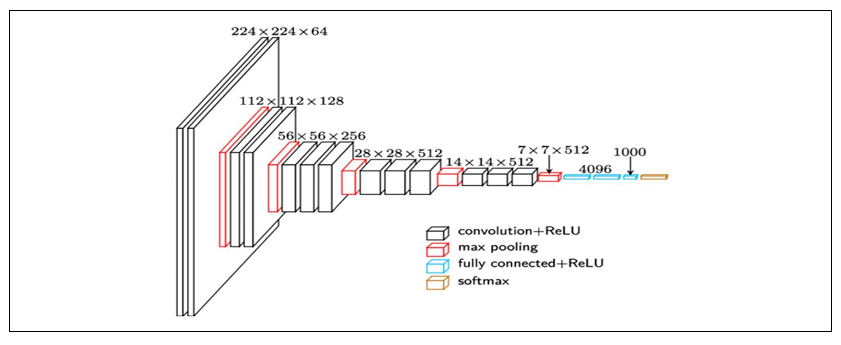
The architecture can be broken down into five blocks, with each block consisting of one or more convolutional layers followed by a max pooling layer. The first two blocks contain two convolutional layers each, while the last three blocks contain three convolutional layers each. The fully connected layers are located at the end of the network. It achieves state-of-the-art performance on a variety of computer vision tasks, including image classification and detection. Its simple architecture and small filter sizes make it a popular choice for transfer learning and fine-tuning on new datasets.
Inception V3
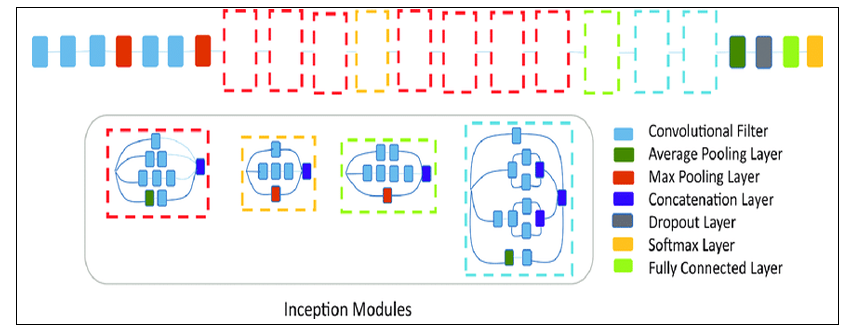
Inception V3 is a deep convolutional neural network architecture that was designed for
image classification and object recognition tasks. It is an improved version of the earlier Inception
V1 and V2 models and has achieved state-of-the-art performance on various benchmarks. The
Inception v3 network consists of a total of 42 layers, including multiple convolutional layers with
various kernel sizes, max pooling layers, and fully connected layers. The key innovation of the
Inception v3 architecture is the use of inception modules, which are designed to capture information
at different scales and resolutions.
EfficientNet B2
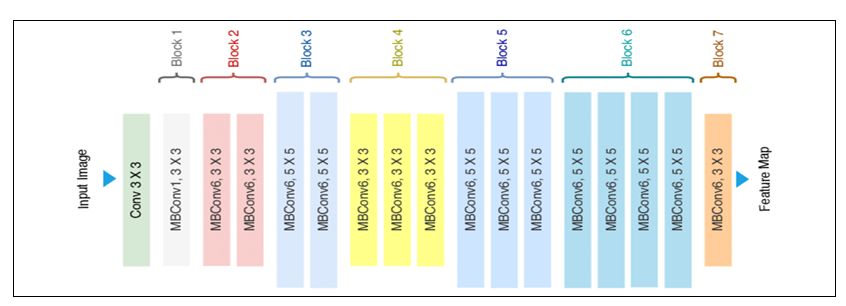
The EfficientNet B2 architecture is based on a compound scaling method that optimizes both depth and width dimensions. It consists of 23 convolutional layers, including 6 convolutional layers, 3 pooling layers, and 2 fully connected layers. The architecture also includes multiple feature extraction layers, followed by multiple classification layers. The input image is first processed by a series of convolutional layers with different kernel sizes and strides, which help to extract features from the image at different scales. The output of these convolutional layers is then passed through a series of pooling layers, which help to reduce the spatial dimensions of the feature maps. After the pooling layers, the features are passed through a series of fully connected layers, which help to classify the image into different categories. The final output layer of the network consists of three nodes, and the output is a probability distribution over these classes.
Methodology
The methodology for brain tumor detection using CNN and Transfer Learning typically involves
the following steps:
1.Data Collection:
- Gather a diverse and representative dataset of brain MRI scans, including both tumor and non-tumor cases.
- Ensure proper annotation of the dataset, labeling the tumor regions accurately.
- Pre-processing
- Normalize the intensity values of the MRI scans to reduce variability.
- Perform skull stripping to remove non-brain tissues and focus only on the relevant regions.
- Resample the images to a consistent resolution for input to the CNN model.
- Augment the dataset by applying transformations such as rotations, flips, and scaling to increase its diversity and robustness.
- Pre-trained CNN Selection:
- Choose a suitable pre-trained CNN model, such as VGG, ResNet, or Inception, which has been trained on a large-scale dataset like ImageNet.
- Consider the architecture's depth, complexity, and performance on similar computer vision tasks.
- Transfer Learning:
- Remove the final classification layers of the pre-trained CNN model while retaining the feature extraction layers.
- Freeze the weights of the pre-trained layers to prevent them from being updated during training.
- Add new fully connected layers on top of the pre-trained layers for tumor classification.
- Initialize the weights of the newly added layers randomly or using a specific initialization strategy.
- Training:
- Split the dataset into training, validation, and test sets.
- Train the CNN model using the training set, feeding the pre-processed MRI scans as input and the corresponding tumor labels as targets.
- Use an appropriate loss function, such as binary cross-entropy or focal loss, to optimize the model's parameters.
- Regularize the model using techniques like dropout or L2 regularization to prevent overfitting.
- Monitor the model's performance on the validation set, adjusting hyperparameters and model architecture as necessary.
- Fine-tuning:
- After initial training, gradually unfreeze some of the pre-trained layers and allow their weights to be updated during further training.
- Fine-tune the model using a smaller learning rate to enable the network to adapt to the specific characteristics of the brain tumor dataset.
- Evaluation:
- Assess the trained model's performance on the test set, measuring metrics such as accuracy, precision, recall, and F1 score.
- Analyze the confusion matrix to evaluate the model's false positive and false negative rates.
- Compare the results with existing state-of-the-art methods and benchmarks.
- Post-processing:
- Apply post-processing techniques, such as thresholding, morphological operations, and connected component analysis, to refine the tumor predictions and remove false positives.
- Interpretability and Explainability:
- Employ techniques like Grad-CAM or saliency maps to visualize the regions of the MRI scans that contributed most to the tumor prediction.
- Provide insights and explanations to aid radiologists and medical professionals in understanding and validating the model's predictions.
- Validation and Generalization:
- Validate the trained model on an external dataset or perform cross-validation to assess its generalization capability.
- Test the model's performance on different tumor subtypes or variations to evaluate its robustness.
- Deployment:
- Integrate the trained model into a user-friendly application or system that allows healthcare professionals to input MRI scans and obtain accurate tumor predictions.
- Ensure scalability and efficiency of the deployed system to handle real-time or high volume processing demands.
- Continual Improvement:
- Keep exploring advanced CNN architectures, transfer learning strategies, and regularization techniques to enhance the model's performance and address any limitations identified during the evaluation and deployment stages.
- Stay updated with the latest research and techniques in the field of brain tumor detection to incorporate new advancements into the methodology.
Experiments Setup
The brain tumor detection system utilizes a powerful transfer learning algorithm that is based on deep learning techniques. This algorithm is specifically designed to accurately recognize and classify brain tumor in MRI images. To implement this algorithm, models are created using the TensorFlow framework, with the Keras library in Python. In order to carry out the computational tasks required for the project, the implementation was performed on Google Colab, which provides a free online cloud service with 15 GB of storage space on Google Drive. One of the key advantages of Colab is that it provides access to a virtual GPU powered by NVIDIA Tesla K80 with 12 GB RAM, which greatly speeds up the training of deep learning models. By utilizing these resources, the project was able to be completed in a cost-effective and efficient manner, without the need for expensive local hardware. This approach allows for greater accessibility and democratization of deep learning technology, which can lead to more widespread applications and benefits in the field of medical imaging.
Implementation
from google.colab import drive
drive.mount('/content/drive')
!pip install keras==2.10.0
!pip install tensorflow==2.10.0
!pip install h5py==3.7.0
!pip install efficientnet
#!unzip /content/drive/MyDrive/brain_tumor/archive.zip -d /content/drive/MyDrive/brain_tumor/Data
import numpy as np
import pandas as pd
import seaborn as sns
import matplotlib.pyplot as plt
import os
import cv2
from sklearn.model_selection import train_test_split
from tqdm import tqdm
from PIL import Image
import io

import tensorflow as tf
from tensorflow import keras
from tensorflow.keras.preprocessing.image import ImageDataGenerator
from tensorflow.keras.preprocessing.image import img_to_array
from sklearn.utils import shuffle
from sklearn.model_selection import train_test_split
import efficientnet.keras as effnet
from keras.layers import GlobalAveragePooling2D, Dropout, Dense
from keras.models import Model
from tensorflow.keras import layers
from keras.layers import Conv2D, Input, ZeroPadding2D, BatchNormalization, Activation, MaxPooling2D, Flatten, Dense
from tensorflow.keras.callbacks import EarlyStopping, ReduceLROnPlateau, TensorBoard, ModelCheckpoint
from keras.models import Model, load_model
from tensorflow.keras import Input
from keras.layers import Dense, Dropout, Flatten, Conv2D, MaxPool2D, BatchNormalization, AveragePooling2D, GlobalAveragePooling2D
from sklearn.metrics import classification_report, confusion_matrix
from IPython.display import display, clear_output
import ipywidgets as widgets

from sklearn.metrics import confusion_matrix, classification_report
import itertools

from keras.utils.np_utils import to_categorical
from keras.models import Sequential
from keras.layers import Dense, Dropout, Flatten, Conv2D, MaxPool2D
from tensorflow.keras.optimizers import RMSprop,Adam
from keras.preprocessing.image import ImageDataGenerator
from keras.callbacks import ReduceLROnPlateau
from keras.callbacks import EarlyStopping
labels = ['glioma_tumor', 'meningioma_tumor', 'no_tumor', 'pituitary_tumor']
X_train = []
Y_train  = []
X_test = []
Y_test = []
image_size=150
default_image_size = tuple((150, 150))

for label in labels:
    trainPath = os.path.join('/content/drive/MyDrive/brain_tumor/Data/Training',label)
    for file in tqdm(os.listdir(trainPath)):
        image = cv2.imread(os.path.join(trainPath, file))
        image = cv2.resize(image, (image_size, image_size))
        X_train.append(image)
        Y_train.append(label)

    testPath = os.path.join('/content/drive/MyDrive/brain_tumor/Data/Testing',label)
    for file in tqdm(os.listdir(testPath)):
        image = cv2.imread(os.path.join(testPath, file))
        image = cv2.resize(image, (image_size, image_size))
        X_test.append(image)
        Y_test.append(label)

X_train = np.array(X_train)
X_test = np.array(X_test)
fig, ax = plt.subplots(1,4, figsize=(20,20))
k = 0
for i in range(0,4):
    if i==0: idx=0
    elif i==1: idx=827
    elif i==2: idx=1649
    else: idx=2045
    ax[k].imshow(X_train[idx])
    ax[k].set_title(Y_train[idx])
    ax[k].axis('off')
    k+=1
X_train, Y_train = shuffle(X_train, Y_train, random_state=28)
X_train.shape
sns.countplot(Y_test)
sns.countplot(Y_train)
y_train_ = []
for i in Y_train:
    y_train_.append(labels.index(i))
Y_train = y_train_

Y_train = tf.keras.utils.to_categorical(Y_train)

y_test_ = []
for i in Y_test:
    y_test_.append(labels.index(i))
Y_test = y_test_

Y_test = tf.keras.utils.to_categorical(Y_test)
x_train, x_test, y_train, y_test = train_test_split(X_train, Y_train, test_size=0.1, random_state=28)
x_train, x_val, y_train, y_val = train_test_split(x_train, y_train, test_size=0.1, random_state=28)
CNN
def build_model(input_shape):

    X_input = Input(input_shape)

    X = ZeroPadding2D((2, 2))(X_input)

    X = Conv2D(32, (7, 7), strides = (1, 1), name = 'conv0')(X)
    X = BatchNormalization(axis = 3, name = 'bn0')(X)
    X = Activation('relu')(X)

    # MAXPOOL
    X = MaxPooling2D((4, 4), name='max_pool0')(X)

    # MAXPOOL
    X = MaxPooling2D((4, 4), name='max_pool1')(X)

    # FLATTEN X
    X = Flatten()(X)
    # FULLYCONNECTED
    X = Dense(4, activation='sigmoid', name='fc')(X) # shape=(?, 1)

    model = Model(inputs = X_input, outputs = X, name='BrainDetectionModel')

    return model
IMG_SHAPE = (150, 150, 3)
model = build_model(IMG_SHAPE)
model.compile(optimizer='sgd', loss='categorical_crossentropy', metrics=['accuracy'])
model.summary()
history = model.fit(x=x_train, y=y_train, batch_size=32, epochs=10, validation_data=(x_val, y_val))
#accuracy and loss plot

plt.plot(history.history['accuracy'])
plt.plot(history.history['val_accuracy'])
plt.title('Accuracy')
plt.ylabel('accuracy')
plt.xlabel('epoch')
plt.legend(['train','test'], loc='upper left')
plt.show()


#loss plot
plt.plot(history.history['loss'])
plt.plot(history.history['val_loss'])
plt.title('model loss')
plt.ylabel('loss')
plt.xlabel('epoch')
plt.legend(['train','test'], loc='upper left')
plt.show()
pred = model.predict(x_test)
pred = np.argmax(pred,axis=1)
y_test_new = np.argmax(y_test,axis=1)
cmat = confusion_matrix(y_test_new,pred)
plt.figure(figsize=(6,6))
sns.heatmap(cmat, annot = True, cbar = False);
print(classification_report(y_test_new,pred))
from sklearn.metrics import precision_recall_fscore_support
res = []
for l in range(4):
     prec,recall,_,_ = precision_recall_fscore_support(y_test_new==l,
                                                  pred==l,
                                                  pos_label=True,average=None)
     res.append([l,recall[0],recall[1]])

pd.DataFrame(res,columns = ['class','sensitivity','specificity'])
VGG16
from tensorflow.keras.applications.vgg16 import VGG16
base_model = VGG16(
    weights='imagenet',
    include_top=False,
    input_shape=(150,150,3)
)
from tensorflow.keras.layers.experimental import preprocessing
model1 = keras.Sequential([

    preprocessing.RandomFlip('horizontal'),

    base_model, #vgg16

    layers.Flatten(),
    layers.Dropout(.25),
    layers.Dense(units=256, activation="relu"),
    layers.Dense(units=4, activation="sigmoid"),
])
model1.compile(
    optimizer=tf.keras.optimizers.Adam(),
    loss='categorical_crossentropy',
    metrics=['accuracy']
)
history1 = model1.fit(x=x_train, y=y_train, batch_size=32, epochs=10, validation_data=(x_val, y_val))
#accuracy and loss plot

plt.plot(history1.history['accuracy'])
plt.plot(history1.history['val_accuracy'])
plt.title('Accuracy')
plt.ylabel('accuracy')
plt.xlabel('epoch')
plt.legend(['train','test'], loc='upper left')
plt.show()


#loss plot
plt.plot(history1.history['loss'])
plt.plot(history1.history['val_loss'])
plt.title('model loss')
plt.ylabel('loss')
plt.xlabel('epoch')
plt.legend(['train','test'], loc='upper left')
plt.show()
pred = model1.predict(x_test)
pred = np.argmax(pred,axis=1)
y_test_new = np.argmax(y_test,axis=1)
cmat = confusion_matrix(y_test_new,pred)
plt.figure(figsize=(6,6))
sns.heatmap(cmat, annot = True, cbar = False, cmap='Paired', fmt="d");
print(classification_report(y_test_new,pred))
from sklearn.metrics import precision_recall_fscore_support
res = []
for l in range(4):
     prec,recall,_,_ = precision_recall_fscore_support(y_test_new==l,
                                                  pred==l,
                                                  pos_label=True,average=None)
     res.append([l,recall[0],recall[1]])

pd.DataFrame(res,columns = ['class','sensitivity','specificity'])
InceptionV3
nasnet=tf.keras.applications.inception_v3.InceptionV3(include_top=False,input_shape=(image_size, image_size, 3))
x=tf.keras.layers.Flatten()(nasnet.output)
x=tf.keras.layers.Dense(4)(x)
out=tf.keras.layers.Activation(activation='sigmoid')(x)

model=tf.keras.Model(inputs=nasnet.input,outputs=out)

model.compile(optimizer=tf.keras.optimizers.RMSprop(),loss='categorical_crossentropy',metrics=['accuracy'])
model.summary()
history = model.fit(x_train,y_train,batch_size=16,epochs=10,validation_data=(x_val,y_val))
#accuracy and loss plot

plt.plot(history.history['accuracy'])
plt.plot(history.history['val_accuracy'])
plt.title('Accuracy')
plt.ylabel('accuracy')
plt.xlabel('epoch')
plt.legend(['train','test'], loc='upper left')
plt.show()


#loss plot
plt.plot(history.history['loss'])
plt.plot(history.history['val_loss'])
plt.title('model loss')
plt.ylabel('loss')
plt.xlabel('epoch')
plt.legend(['train','test'], loc='upper left')
plt.show()
pred = model.predict(x_test)
pred = np.argmax(pred,axis=1)
y_test_new = np.argmax(y_test,axis=1)
cmat = confusion_matrix(y_test_new,pred)
plt.figure(figsize=(6,6))
sns.heatmap(cmat, annot = True, cbar = False, cmap='Paired', fmt="d");
print(classification_report(y_test_new,pred))
from sklearn.metrics import precision_recall_fscore_support
res = []
for l in range(4):
     prec,recall,_,_ = precision_recall_fscore_support(y_test_new==l,
                                                  pred==l,
                                                  pos_label=True,average=None)
     res.append([l,recall[0],recall[1]])

pd.DataFrame(res,columns = ['class','sensitivity','specificity'])
EfficientNetB2
base_model = effnet.EfficientNetB2(weights='imagenet', include_top=False, input_shape=(image_size, image_size, 3))
model = base_model.output
model = GlobalAveragePooling2D()(model)
model = Dense(4, activation='softmax')(model)
model = Model(inputs = base_model.input, outputs=model)
model.compile(loss='categorical_crossentropy', optimizer='adam', metrics=['accuracy'])
model.summary()
history2 = model.fit(x_train, y_train, batch_size=32,
                              validation_data=(x_val, y_val),
                              epochs=10,
                              verbose=1,)
#model.save('/content/drive/MyDrive/brain_tumor/models/efficientnetB2.h5')
#accuracy and loss plot

plt.plot(history2.history['accuracy'])
plt.plot(history2.history['val_accuracy'])
plt.title('Accuracy')
plt.ylabel('accuracy')
plt.xlabel('epoch')
plt.legend(['train','test'], loc='upper left')
plt.show()


#loss plot
plt.plot(history2.history['loss'])
plt.plot(history2.history['val_loss'])
plt.title('model loss')
plt.ylabel('loss')
plt.xlabel('epoch')
plt.legend(['train','test'], loc='upper left')
plt.show()
pred = model.predict(x_test)
pred = np.argmax(pred,axis=1)
y_test_new = np.argmax(y_test,axis=1)
cmat = confusion_matrix(y_test_new,pred)
plt.figure(figsize=(6,6))
sns.heatmap(cmat, annot = True, cbar = False, cmap='Paired', fmt="d");
print(classification_report(y_test_new,pred))
from sklearn.metrics import precision_recall_fscore_support
res = []
for l in range(4):
     prec,recall,_,_ = precision_recall_fscore_support(y_test_new==l,
                                                  pred==l,
                                                  pos_label=True,average=None)
     res.append([l,recall[0],recall[1]])

pd.DataFrame(res,columns = ['class','sensitivity','specificity'])
Testing
from keras.models import load_model
default_image_size = tuple((150, 150))

imglist=[]
image = cv2.imread('/content/drive/MyDrive/brain_tumor/Data/Testing/no_tumor/image(1).jpg')
image = cv2.resize(image, default_image_size)
img= img_to_array(image)

imglist.append(img)
np_image_list = np.array(imglist)
model =load_model('/content/drive/MyDrive/brain_tumor/models/efficientnetB2.h5')
preditcion=model.predict(np_image_list)
print(preditcion)
print(max(preditcion[0]))

pred_= preditcion[0]
pred=[]
for ele in pred_:
  pred.append(ele)


maxi_ele = max(pred)
idx = pred.index(maxi_ele)
final_class=['glioma_tumor', 'meningioma_tumor', 'no_tumor', 'pituitary_tumor']
class_name= final_class[idx]
print("Predicted Class Is : " + str(class_name))
Graph
The graph of accuracy and validation loss during training and testing can provide valuable insights into the performance of a brain tumor detection model and help identify any issues that need to be addressed. Magnetic Resonance Images (MRI) dataset is divided into training and testing datasets. The accuracy vs. epoch graph for training and testing shown in below diagram.
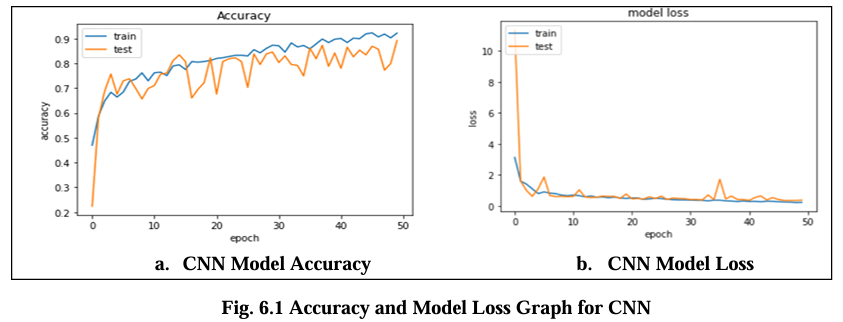
Fig. 6.1 Graph displays the accuracy and model loss values for the CNN model trained on the Magnetic Resonance Images (MRI) dataset over the 50 epochs. The loss is about 0.2 indicate the error rate of the model with lower values indicating better performance and its highest accuracy are 88.00%.
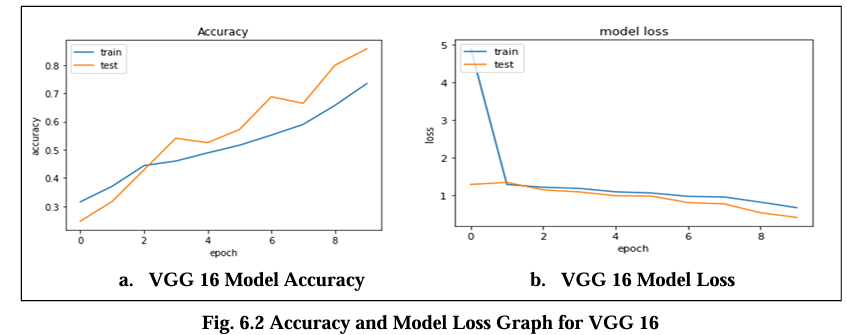
Fig. 6.2 Graph displays the accuracy and model loss values for the VGG 16 model trained on the Magnetic Resonance Images (MRI) dataset over the 10 epochs. The loss is about 0.19 indicate the error rate of the model with lower values indicating better performance and its accuracy are 82.02%.
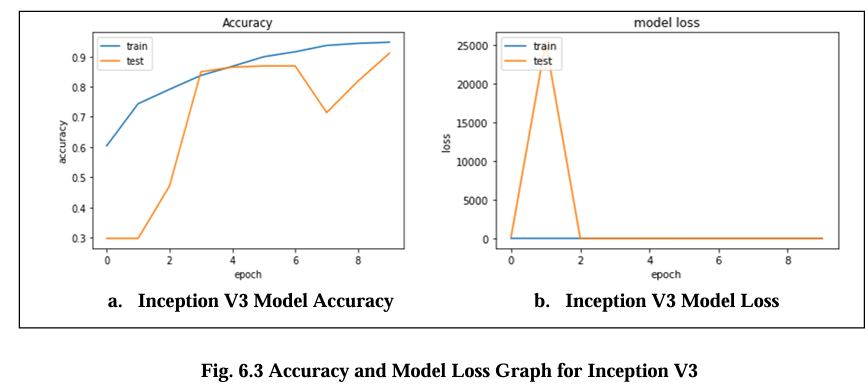
Fig. 6.3 Graph displays the accuracy and model loss values for the Inception V3 model. The loss diagram curve should exhibit a decreasing trend, indicating that the model is learning and improving its performance. The loss is about 0.16 and its accuracy are 90.2%.
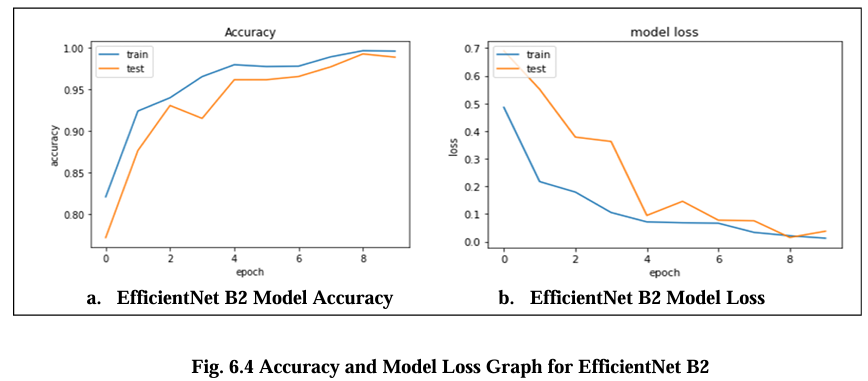
Fig. 6.4 Graph displays the accuracy and model loss values for the Efficient Net B2 model. The fig. a. model accuracy graph illustrates the performance of the model in terms of correctly classified samples over time. It shows in diagram the percentage of samples that are accurately classified by the model during training. The occasional fluctuations in accuracy can occur due to the complexity of the dataset or training process. The fluctuations or sudden increases in the loss can occur in fig. b due to various factors such as overfitting, learning rate adjustments, or changes in the training data. EfficientNet B2 achieved the highest accuracy, with a score of 97.5%, and the lowest model loss score are 0.14.
Confusion Matrix
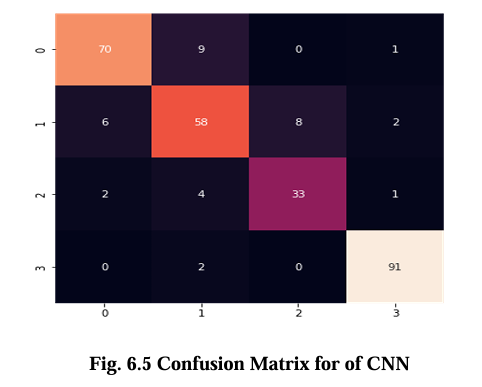
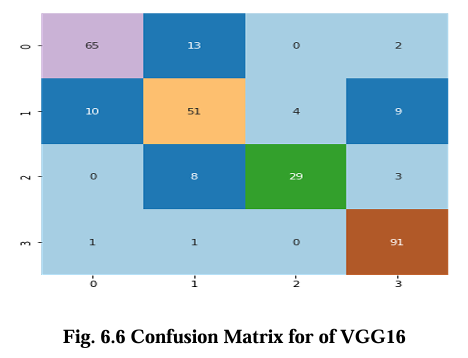
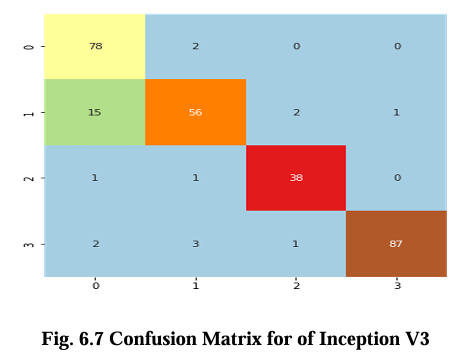
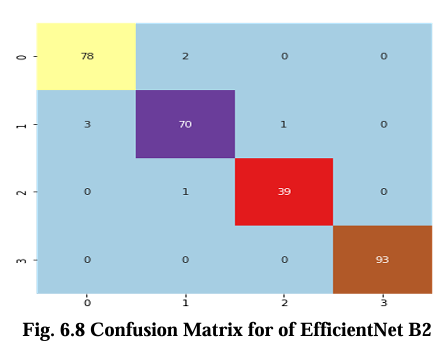
The confusion matrix for CNN, VGG16, Inception V3, and EfficientNet B2 model is presented in Figures 6.5, 6.6, 6.7, and 6.8 respectively. These matrices depict the performance of the models in detecting brain tumors categorized as glioma, meningioma, no tumor, and pituitary tumor. The diagonal cells in the matrix represent the number of correctly classified samples, while the off diagonal cells represent the number of misclassified samples. The results show that all models had high accuracy in detecting glioma, meningioma, and pituitary tumor. CNN, VGG16 and Inception V3 had similar accuracy for all types of tumors, while EfficientNet B2 had slightly lower accuracy for meningioma. In terms of false positives and false negatives, VGG16 and Inception V3 had fewer errors compared to EfficientNet B2. VGG16 had the lowest number of false positives for all tumor types, while Inception V3 had the lowest number of false negatives for glioma and pituitary tumor. The confusion matrix provides useful insights into the strengths and weaknesses of each model and can guide further improvements in the classification accuracy.
Results

Table No. 6.1 presents VGG16, Inception V3, and EfficientNet B2 optimized model comparison results based on the precision, recall, F1-score, specificity, sensitivity, accuracy. Specifically, the proposed model utilizing EfficientNet B2 obtained an overall accuracy of 97.5%. This indicates that EfficientNet B2 outperformed the other models in accurately classifying brain tumor images in the dataset.
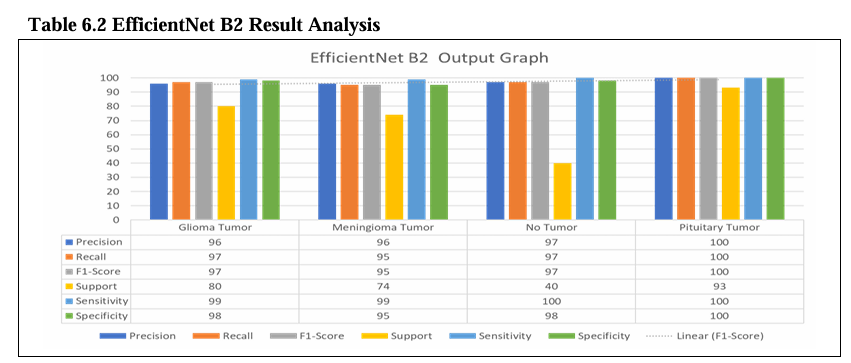
Table No. 6.2 shows the evaluation of EfficientNet B2 models for brain tumor detection. The models were trained to detect four different types of tumors. Glioma, Meningioma, Pituitary, and No Tumor. For each model and tumor type, the table shows the precision, recall, F1-score, support, sensitivity, specificity, avg. accuracy, and avg. loss.
The implementation platform for brain tumor detection using deep learning serves as the foundation for the upcoming chapter. It encompasses the technological framework and tools employed to develop and deploy deep learning models for accurate tumor identification in the brain. This section focuses on the practical aspects of applying deep learning algorithms to detect brain tumors, including the necessary software components. By leveraging the power of this platform, we aim to achieve accurate and efficient brain tumor detection, thus contributing to improved medical diagnostics and patient care.
Challenges Faced
Key Learnings
Future Directions
Conclusion
In this study, the proposed brain tumor detection technique using transfer learning models based on VGG16, Inception V3, and EfficientNet B2 generated excellent outcomes in accurate detection and classification based on texture, location and shape. According to the results from the study, the use of MRI brain image dataset showed that, EfficientNet B2 had the most accurate accuracy of 97.5%, the Inception V3 with 90.2% accuracy and VGG16 with 82.2% accuracy. This technique has the potential to significantly assist patients by enabling early detection and improved treatment. In the future, if further developed and optimized, they could eventually be utilized to enhance the accuracy and effectiveness of brain tumor identification. In addition, advancements in computing power and data acquisition techniques could enable the development of more powerful models, resulting in a more accurate and reliable diagnosis of brain tumor.
References
[1] Sushreeta Tripathya, Rishabh Singhb, Mousim Rayc, “Automation of Brain Tumor Identification using EfficientNet on Magnetic Resonance Images”, International Conference on Machine Learning and Data Engineering, pp. 1551–1560, 2023.
[2] Neelamadhab Padhy, Dillip Ranjan Nayak, Pradeep Kumar Mallick, Sachin Kumar, Mikhail Zymbler, “Brain Tumor Classification Using Dense Efficient-Net”, Article, vol. 11, pp. 34, 2022.
[3] Malik Loudini, Ouiza Nait Belaid, “Classification of Brain Tumor by Combination of Pre-Trained VGG16 CNN”, Journal of Information Technology Management, vol.12, no.2, pp. 13-25, 2020.
[4] T Samitha, Gopika S, “Brain Tumor Classification using EfficientNet Models”, International Research Journal of Engineering and Technology, vol. 09, no.8, pp. 868-873, 2022.
[5] Rozana Sukaik, Ahmad Saleh, Samy S. Abu-Naser, “Brain Tumor Classification Using Deep Learning”, International Conference on Assistive and Rehabilitation Technologies, 978-1-7281-9782-1, 2020.
[6] Li Qiang, Mohammed Jajere Adamu, Ayesha Younis, Charles Okanda NyategaHalima Bello Kawuwa, “Brain Tumor Analysis Using Deep Learning and VGG‐16 Ensembling Learning Approaches”, Applied Science, vol. 12, 2022.
[7] Ameur Ikhlef, Rayene Chelghoum, Amina Hameurlaine, Sabir Jacquir, “Transfer Learning Using Convolutional Neural Network Architectures for Brain Tumor Classification from MRI Images”, Springer, pp. 189–200, 2020.
[8] Nandini Prasad K. S., Chetana Srinivas, Mohammed Zakariah, Yousef Ajmi Alothaibi , Kamran Shaukat, B. Partibane, Halifa Awal, “Deep Transfer Learning Approaches in Performance Analysis of Brain Tumor Classification Using MRI Images”, Journal of Healthcare Engineering, 2022.
[9] Wu Jue, Hassan Ali Khan, Muhammad Mushtaq, Muhammad Umer Mushtaq, “Brain tumor classification in MRI image using convolutional neural network”, Mathematical Biosciences and Engineering, vol. 17, no. 5, pp. 6203–6216, 2020.
[10] Jae-Mo Kang, Jun-Hyun Park, Anand Paul, Hasnain Ali Shah, Faisal Saeed, Sangseok Yun, Jun-Hyun Park, Anand Paul, “A Robust Approach for Brain Tumor Detection in Magnetic Resonance Images Using Finetuned Efficient Net”, IEEE Access, vol. 10, pp. 65426-65438,2022